The Office of the Economic Adviser, Department for Promotion of Industry and Internal Trade is releasing Index of Eight Core Industries for the Month of January, 2021.
The combined Index of Eight Core Industries stood at 137.6 in January,2021, which increasedby 0.1 (provisional) per cent as compared to the Index of January, 2020.Its cumulative growth during April to January, 2020-21 has been(-) 8.8%.
Final growth rate of Index of Eight Core Industries for October’2020 is revised to(-) 0.5%from its provisional level(-2.5%).The Eight Core Industries comprise 40.27 per cent of the weight of items included in the Index of Industrial Production (IIP).Details of yearly and monthly index and their growth rate are provided atAnnexure I & II.
Monthly growth rates of Index of Eight Core Industries (Overall) is depicted in the graph:
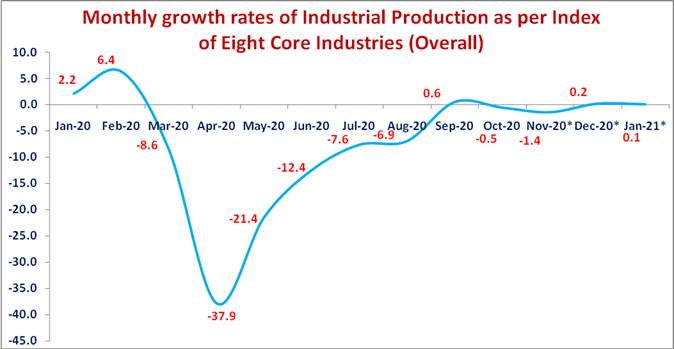
*provisional
The summary of the Index of Eight Core Industries is given below:
Coal-Coal production (weight: 10.33per cent) declined by 1.8 per cent in January, 2021 over January,2020. Its cumulative index declined by 1.9 per cent during April toJanuary, 2020-21over corresponding period of the previous year.
Crude Oil-Crude Oil production (weight: 8.98per cent) declined by 4.6 per cent inJanuary, 2021 over January,2020. Its cumulative index declined by 5.6 per cent during April toJanuary, 2020-21over the corresponding period of previous year.
Natural Gas- The Natural Gas production (weight:6.88per cent) declinedby2.0 per cent in January, 2021 over January,2020. Its cumulative index declined by 10.7 per cent during April to January, 2020-21 over the corresponding period of previous year.
Petroleum Refinery Products- Petroleum Refinery production (weight:28.04per cent) declined by 2.6 per cent in January, 2021 over January,2020. Its cumulative index declinedby 12.4per cent during April to January, 2020-21over the corresponding period of previous year.
Fertilizers-Fertilizers production (weight:2.63 per cent) increasedby 2.7 per cent in January,2021 overJanuary,2020. Its cumulative index increasedby 3.0 per cent during April toJanuary, 2020-21 over the corresponding period of previous year.
Steel-Steel production (weight:17.92per cent)increased by 2.6 per cent inJanuary, 2021 over January,2020. Its cumulative index declined by 14.0per centduring April to January, 2020-21 over the corresponding period of previous year.
Cement-Cement production (weight:5.37per cent) declinedby5.9per cent inJanuary, 2021 overJanuary,2020. Its cumulative index declinedby16.6per centduring April to January, 2020-21over the corresponding period of previous year.
Electricity- Electricity generation (weight:19.85per cent) increasedby5.1per cent in January,2021over January,2020. Its cumulative indexdeclined by 2.7 per cent duringApril to January, 2020-21over the corresponding period of previous year.
Note 1: Data for November, 2020, December, 2020and January, 2021are provisional.
Note 2: Since April, 2014, Electricity generation data from Renewable sources are also included.
Note 3: The industry-wise weights indicated above are individual industry weight derived from IIP and blown up on pro rata basis to a combined weight of ICI equal to 100.
Note 4: Since March 2019, a new steel product called Hot Rolled Pickled and Oiled (HRPO) under the item ‘Cold Rolled (CR) coils’ within the production of finished steel has also been included.
Note5: Release of the index for February, 2021 will be on Wednesday31st March,2021.
Annexure I
Performance of Eight Core Industries
Yearly Index & Growth Rate
Base Year: 2011-12=100
Index
| Sector | Weight | 2012-13 | 2013-14 | 2014-15 | 2015-16 | 2016-17 | 2017-18 | 2018-19 | 2019-20 | Apr- Jan 2019-20 | Apr- Jan 2020-21* |
| Coal | 10.3335 | 103.2 | 104.2 | 112.6 | 118.0 | 121.8 | 124.9 | 134.1 | 133.6 | 122.3 | 120.0 |
| Crude Oil | 8.9833 | 99.4 | 99.2 | 98.4 | 97.0 | 94.5 | 93.7 | 89.8 | 84.5 | 85.3 | 80.5 |
| Natural Gas | 6.8768 | 85.6 | 74.5 | 70.5 | 67.2 | 66.5 | 68.4 | 69.0 | 65.1 | 66.3 | 59.2 |
| Refinery Products | 28.0376 | 107.2 | 108.6 | 108.8 | 114.1 | 119.7 | 125.2 | 129.1 | 129.4 | 128.9 | 112.9 |
| Fertilizers | 2.6276 | 96.7 | 98.1 | 99.4 | 106.4 | 106.6 | 106.6 | 107.0 | 109.8 | 111.2 | 114.5 |
| Steel | 17.9166 | 107.9 | 115.8 | 121.7 | 120.2 | 133.1 | 140.5 | 147.7 | 152.6 | 154.5 | 132.9 |
| Cement | 5.3720 | 107.5 | 111.5 | 118.1 | 123.5 | 122.0 | 129.7 | 147.0 | 145.7 | 145.8 | 121.6 |
| Electricity | 19.8530 | 104.0 | 110.3 | 126.6 | 133.8 | 141.6 | 149.2 | 156.9 | 158.4 | 160.0 | 155.6 |
| Overall Index | 100.00 | 103.8 | 106.5 | 111.7 | 115.1 | 120.5 | 125.7 | 131.2 | 131.6 | 131.2 | 119.6 |
*provisional
Growth Rates (on Y-o-Y basis in per cent)
| Sector | Weight | 2012-13 | 2013-14 | 2014-15 | 2015-16 | 2016-17 | 2017-18 | 2018-19 | 2019-20 | Apr- Jan 2019-20 | Apr- Jan 2020-21* |
| Coal | 10.3335 | 3.2 | 1.0 | 8.0 | 4.8 | 3.2 | 2.6 | 7.4 | -0.4 | -2.5 | -1.9 |
| Crude Oil | 8.9833 | -0.6 | -0.2 | -0.9 | -1.4 | -2.5 | -0.9 | -4.1 | -5.9 | -6.0 | -5.6 |
| Natural Gas | 6.8768 | -14.4 | -12.9 | -5.3 | -4.7 | -1.0 | 2.9 | 0.8 | -5.6 | -4.3 | -10.7 |
| Refinery Products | 28.0376 | 7.2 | 1.4 | 0.2 | 4.9 | 4.9 | 4.6 | 3.1 | 0.2 | -0.4 | -12.4 |
| Fertilizers | 2.6276 | -3.3 | 1.5 | 1.3 | 7.0 | 0.2 | 0.03 | 0.3 | 2.7 | 4.2 | 3.0 |
| Steel | 17.9166 | 7.9 | 7.3 | 5.1 | -1.3 | 10.7 | 5.6 | 5.1 | 3.4 | 6.4 | -14.0 |
| Cement | 5.3720 | 7.5 | 3.7 | 5.9 | 4.6 | -1.2 | 6.3 | 13.3 | -0.9 | 1.1 | -16.6 |
| Electricity | 19.8530 | 4.0 | 6.1 | 14.8 | 5.7 | 5.8 | 5.3 | 5.2 | 0.9 | 0.9 | -2.7 |
| Overall Growth | 100.00 | 3.8 | 2.6 | 4.9 | 3.0 | 4.8 | 4.3 | 4.4 | 0.4 | 0.8 | -8.8 |
*provisional
Annexure II
Performance of Eight Core Industries
Monthly Index & Growth Rate
Base Year: 2011-12=100
Index
| Sector | Coal | Crude Oil | Natural Gas | Refinery Products | Fertilizers | Steel | Cement | Electricity | Overall Index |
| Weight | 10.3335 | 8.9833 | 6.8768 | 28.0376 | 2.6276 | 17.9166 | 5.3720 | 19.8530 | 100.00 |
| Jan-20 | 164.7 | 85.0 | 65.3 | 134.4 | 116.5 | 155.4 | 164.1 | 155.6 | 137.4 |
| Feb-20 | 171.1 | 75.6 | 58.3 | 128.9 | 107.8 | 152.9 | 160.7 | 153.6 | 134.0 |
| Mar-20 | 209.7 | 85.0 | 60.1 | 135.3 | 98.3 | 133.2 | 129.8 | 146.9 | 134.0 |
| Apr-20 | 103.7 | 80.2 | 53.3 | 94.2 | 85.0 | 26.9 | 22.5 | 125.6 | 81.2 |
| May-20 | 109.4 | 82.0 | 57.2 | 102.0 | 113.4 | 96.4 | 117.3 | 150.6 | 107.7 |
| Jun-20 | 104.3 | 79.6 | 58.1 | 110.6 | 114.6 | 122.3 | 137.8 | 156.2 | 116.3 |
| Jul-20 | 100.3 | 83.0 | 61.2 | 114.5 | 119.4 | 141.9 | 126.8 | 166.3 | 122.5 |
| Aug-20 | 98.2 | 81.2 | 61.0 | 105.9 | 120.8 | 150.7 | 109.1 | 162.7 | 119.7 |
| Sep-20 | 105.6 | 78.3 | 57.5 | 106.3 | 113.5 | 149.9 | 126.8 | 166.4 | 121.4 |
| Oct-20 | 122.4 | 80.9 | 60.6 | 111.5 | 122.8 | 158.4 | 141.3 | 162.2 | 126.7 |
| Nov-20* | 137.9 | 78.3 | 58.4 | 126.5 | 118.5 | 154.1 | 132.1 | 144.8 | 127.4 |
| Dec-20* | 156.2 | 80.5 | 60.8 | 126.9 | 117.0 | 169.5 | 147.8 | 157.9 | 135.9 |
| Jan-21* | 161.7 | 81.1 | 64.0 | 130.9 | 119.7 | 159.5 | 154.5 | 163.5 | 137.6 |
*provisional
Growth Rates (on Y-o-Y basis in per cent)
| Sector | Coal | Crude Oil | Natural Gas | Refinery Products | Fertilizers | Steel | Cement | Electricity | Overall Growth |
| Weight | 10.3335 | 8.9833 | 6.8768 | 28.0376 | 2.6276 | 17.9166 | 5.3720 | 19.8530 | 100.00 |
| Jan-20 | 8.0 | -5.3 | -9.0 | 1.9 | -0.1 | 1.6 | 5.1 | 3.2 | 2.2 |
| Feb-20 | 11.3 | -6.4 | -9.6 | 7.4 | 2.9 | 2.9 | 7.8 | 11.5 | 6.4 |
| Mar-20 | 4.0 | -5.5 | -15.1 | -0.5 | -11.9 | -21.9 | -25.1 | -8.2 | -8.6 |
| Apr-20 | -15.5 | -6.4 | -19.9 | -24.2 | -4.5 | -82.8 | -85.2 | -22.9 | -37.9 |
| May-20 | -14.0 | -7.1 | -16.8 | -21.3 | 7.5 | -40.4 | -21.4 | -14.8 | -21.4 |
| Jun-20 | -15.5 | -6.0 | -12.0 | -8.9 | 4.2 | -23.2 | -6.8 | -10.0 | -12.4 |
| Jul-20 | -5.7 | -4.9 | -10.2 | -13.9 | 6.9 | -6.5 | -13.5 | -2.4 | -7.6 |
| Aug-20 | 3.6 | -6.3 | -9.5 | -19.1 | 7.3 | 0.5 | -14.5 | -1.8 | -6.9 |
| Sep-20 | 21.0 | -6.0 | -10.6 | -9.5 | -0.3 | 6.2 | -3.4 | 4.8 | 0.6 |
| Oct-20 | 11.7 | -6.2 | -8.6 | -17.0 | 6.3 | 5.9 | 3.2 | 11.2 | -0.5 |
| Nov-20* | 3.3 | -4.9 | -9.3 | -4.8 | 1.6 | -0.5 | -7.3 | 3.5 | -1.4 |
| Dec-20* | 2.2 | -3.6 | -7.2 | -2.8 | -2.9 | 2.6 | -7.2 | 5.1 | 0.2 |
| Jan-21* | -1.8 | -4.6 | -2.0 | -2.6 | 2.7 | 2.6 | -5.9 | 5.1 | 0.1 |
*provisional