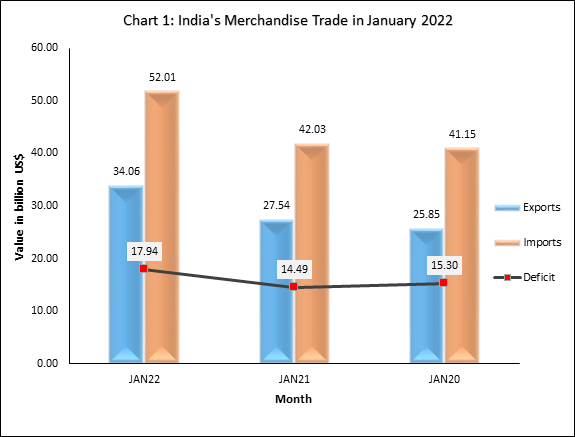
India’s merchandise import in January 2022 was USD 52.01 billion, an increase of 23.74% over USD 42.03 billion in January 2021 and an increase of 26.38% over USD 41.15 billion in January 2020.
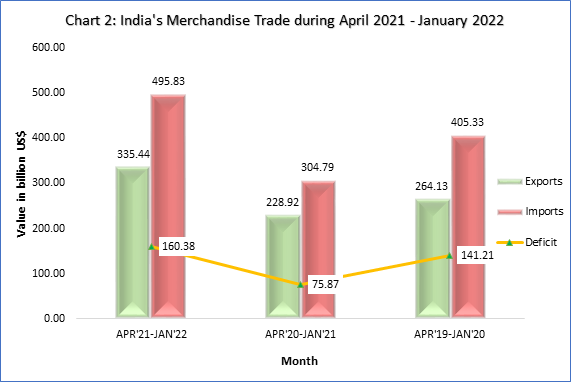
India’s merchandise import in 2021-22 (April-January) was USD 495.83 billion, an increase of 62.68% over USD 304.79 billion in 2020-21 (April-January) and an increase of 22.3% over USD 405.33 billion in 2019-20 (April-January).
The trade deficit in January 2022 was USD 17.94 billion, while it was 160.38 billion USD during 2021-22 (April-January).
| Statement 1: India’s Merchandise Trade in January 2022 | |||||
| Value in Billion USD | % Growth | ||||
| Jan-22 | Jan-21 | Jan-20 | Jan-22 over Jan-21 | Jan-22 over Jan-20 | |
| Exports | 34.06 | 27.54 | 25.85 | 23.69 | 31.75 |
| Imports | 52.01 | 42.03 | 41.15 | 23.74 | 26.38 |
| Deficit | 17.94 | 14.49 | 15.30 | 23.82 | 17.30 |
| Statement 2: India’s Merchandise Trade in 2021-22 (April-January) | |||||
| Value in Billion USD | % Growth | ||||
| 2021-22 (Apr-Jan) | 2020-21 (Apr-Jan) | 2019-20 (Apr-Jan) | 2021-22 (Apr-Jan) over
2020-21 (Apr-Jan) |
2021-22 (Apr-Jan) over
2019-20 (Apr-Jan) |
|
| Exports | 335.44 | 228.90 | 264.13 | 46.53 | 27.0 |
| Imports | 495.83 | 304.79 | 405.33 | 62.68 | 22.30 |
| Deficit | 160.38 | 75.87 | 141.2 | 112.97 | 13.51 |
Value of non-petroleum exports in January 2022 was 30.33 USD billion, registering a positive growth of 19.4% over non-petroleum exports of USD 25.4 billion in January 2021 and a positive growth of 33.81% over non-petroleum exports of USD 22.67 billion in January 2020.
Value of non-petroleum imports was USD 40.57 billion in January 2022 with a positive growth of 24.44% over non-petroleum imports of USD 32.61 billion in January 2021 and a positive growth of 44.19% over non-petroleum imports of USD 28.14 billion in January 2020.
| Statement 3: Merchandise Non-POL Trade in January 2022 | |||||
| Value in Billion USD | % Growth | ||||
| Jan-22 | Jan-21 | Jan-20 | 2021-22 (Apr-Jan) | 2020-21 (Apr-Jan) | |
| Exports | 30.33 | 25.40 | 22.67 | 19.40 | 33.81 |
| Imports | 40.57 | 32.61 | 28.14 | 24.44 | 44.19 |
The cumulative value of non-petroleum exports in 2021-22 (Apr-Jan) was USD 287.84 billion, an increase of 37.59% over USD 209.19 billion in 2020-21 (Apr-Jan) and an increase of 25.8% over USD 228.8 billion in 2019-20 (Apr-Jan).
The cumulative value of non-petroleum imports in 2021-22 (Apr-Jan) was USD 366.14 billion, showing an increase of 51.67% compared to non-oil imports of USD 241.41 billion in 2020-21 (Apr-Jan) and an increase of 23.86% compared to non-oil imports of USD 295.61 billion in 2019-20 (Apr-Jan).
| Statement 4: Merchandise Non-POL Trade 2021-22 (Apr-Jan) | |||||
| Value in Billion USD | % Growth | ||||
| 2021-22(Apr-Jan) | 2021-22 (Apr-Jan) | 2019-20(Apr-Jan) | 2021-22 (Apr-Jan) over
2020-21 (Apr-Jan) |
2021-22 (Apr-Jan) over
2019-20 (Apr-Jan) |
|
| Exports | 287.84 | 209.19 | 228.80 | 37.59 | 25.8 |
| Imports | 366.14 | 241.41 | 295.61 | 51.67 | 23.86 |
Value of non-petroleum and non-gems and jewellery exports in January 2022 was USD 27.09 billion, registering a positive growth of 20.1% over non-petroleum and non-gems and jewellery exports of USD 22.56 billion in January 2021 and a positive growth of 36.92% over non-petroleum and non-gems and jewellery exports of USD 19.79 billion in January 2020.
Value of non-oil, non-GJ (gold, silver & Precious metals) imports was USD 35.22 billion in January 2022 with a positive growth of 33.6%over non-oil and non-GJ imports of USD 26.36 billion in January 2021and a positive growth of 41.63% over non-oil and non-GJ imports of USD 24.87 billion in January 2020.
| Statement 5: Merchandise Non-POL Non-GJ Trade in January 2022 | |||||
| Value in Billion USD | % Growth | ||||
| Jan-22 | Jan-21 | Jan-20 | Jan-22 over Jan-21 | Jan-22 over Jan-20 | |
| Exports | 27.09 | 22.56 | 19.79 | 20.10 | 36.92 |
| Imports | 35.22 | 26.36 | 24.87 | 33.60 | 41.63 |
The cumulative value of non-petroleum and non-gems and jewellery exports in 2021-22 (April-January) was USD 255.69 billion, an increase of 34.95% over cumulative value of non-petroleum and non-gems and jewellery exports of USD 189.47 billion in 2020-21(April-January) and an increase of 29.18% over cumulative value of non-petroleum and non-gems and jewellery exports of USD 197.94 billion in 2019-20 (April-January).
Non-oil, non-GJ (Gold, Silver & Precious Metals) imports was USD 298.65 billion in 2021-22 (April-January), recording a positive growth of 45.06%, as compared to non-oil and non-GJ imports of USD 205.88 billion in 2020-21(April-January) and a positive growth of 19.54% over USD 249.83 billion in 2019-20 (April-January).
| Statement 6: Merchandise Non-POL Non-GJ Trade Apr 2021-Jan 2022 | |||||
| Value in Billion USD | % Growth | ||||
| 2021-22 (Apr-Jan) | 2021-22 (Apr-Jan) | 2019-20 (Apr-Jan) | 2021-22 (Apr-Jan) over
2020-21 (Apr-Jan) |
2021-22 (Apr-Jan) over
2019-20 (Apr-Jan) |
|
| Exports | 255.69 | 189.47 | 197.94 | 34.95 | 29.18 |
| Imports | 298.65 | 205.88 | 249.83 | 45.06 | 19.54 |
Top 10 major commodity groups covering 78% of total exports in January 2022,are –
| Statement 7: Exports of Top 10 Major Commodity Groups | ||||
| Value of Export (Million US$) | Share (%) | Growth (%) | ||
| Major Commodity Group | Jan-22 | Jan-21 | Jan-22 | Jan-22 over Jan-21 |
| Engineering goods | 9201.76 | 7413.15 | 27.01 | 24.13 |
| Petroleum products | 3732.26 | 2136.00 | 10.96 | 74.73 |
| Gems and Jewellery | 3236.98 | 2843.62 | 9.50 | 13.83 |
| Organic and Inorganic chemicals | 2447.89 | 1942.16 | 7.19 | 26.04 |
| Drugs and Pharmaceuticals | 2054.24 | 2075.22 | 6.03 | -1.01 |
| Cotton Yarn/Fabs./Madeups, Handloom products etc. | 1389.46 | 974.54 | 4.08 | 42.58 |
| RMG of all Textiles | 1549.00 | 1295.91 | 4.55 | 19.53 |
| Electronic goods | 1364.63 | 1180.09 | 4.01 | 15.64 |
| Plastic and Linoleum | 844.47 | 638.37 | 2.48 | 32.29 |
| Rice | 813.75 | 769.89 | 2.39 | 5.70 |
| Total of 10 Major Commodity Groups | 26634.46 | 21268.95 | 78.19 | 25.23 |
| Rest | 7428.41 | 6269.33 | 21.81 | 18.49 |
| Total Exports | 34062.87 | 27538.28 | 100.00 | 23.69 |
Top 10 major commodity groups covering 75% of total imports in January 2022, are –
| Statement 8: Imports of Top 10 Major Commodity Groups | ||||
| Import (Million US$) | Share (%) | Growth (%) | ||
| Major Commodity Group | Jan-22 | Jan-21 | Jan-22 | Jan-22 over Jan-21 |
| Petroleum, Crude & products | 11431.59 | 9424.30 | 21.98 | 21.30 |
| Electronic goods | 8216.74 | 5256.61 | 15.80 | 56.31 |
| Gold | 2404.19 | 4035.23 | 4.62 | -40.42 |
| Machinery, electrical & non-electrical | 4038.80 | 3367.71 | 7.77 | 19.93 |
| Organic & Inorganic Chemicals | 2673.76 | 1983.66 | 5.14 | 34.79 |
| Pearls, precious & Semi-precious stones | 2332.04 | 2196.40 | 4.48 | 6.18 |
| Coal, Coke & Briquettes, etc. | 2606.53 | 1865.66 | 5.01 | 39.71 |
| Artificial resins, plastic materials, etc. | 1762.08 | 1530.64 | 3.39 | 15.12 |
| Vegetable Oil | 1858.58 | 1135.45 | 3.57 | 63.69 |
| Non-ferrous metals | 1831.41 | 1349.99 | 3.52 | 35.66 |
| Total of 10 Major Commodity Groups | 39155.69 | 32145.65 | 75.29 | 21.81 |
| Rest | 12850.22 | 9884.42 | 24.71 | 30.00 |
| Total Imports | 52005.91 | 42030.07 | 100.00 | 23.74 |
***