India’s overall exports (Merchandise and Services combined) in April2021* are estimated to be USD 51.79Billion, exhibiting a positive growth of 93.21per cent over the same period last year. Overall imports in April2021* are estimated to be USD 58.72Billion, exhibiting a positive growth of 122.24per cent over the same period last year.
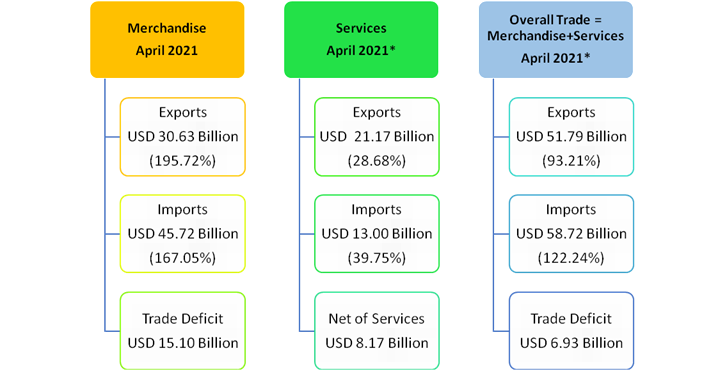
*Note: i) The latest data for services sector released by RBI is for March 2021. The data for April 2021 is an estimation, which will be revised based on RBI’s subsequent release ii) the figures in bracket are growth rates vis-à-vis corresponding period of last year.
I. MERCHANDISE TRADE
EXPORTS (including re-exports)
- Exports in April 2021 were USD 30.63 Billion, as compared to USD 10.36 Billion in April 2020, exhibiting a positive growth of 195.72 per cent. In Rupee terms, exports were Rs. 2,28,071.76 Crore in April 2021, as compared to Rs. 78,951.41 Crore in April 2020, registering a positive growth of 188.88 per cent. As compared to April 2019, exports in April 2021 exhibited a positive growth of 17.62 per cent in Dollar terms and 26.17 per cent in Rupee terms.
- The commodities/commodity groups which have recorded positive growth during April 2021 vis-à-vis April 2020 areGems & jewellery (9271.21%), Jute mfg. including floor covering (1684.62%), Carpet (1352.68%), Handicrafts excl. handmade carpet (1275.46%), Leather & leather products (1201.44%), RMG of all textiles (927.08%), Cotton yarn/fabs./made-ups, handloom products etc. (618.26%), Man-made yarn/fabs./made-ups etc. (587.01%), Other cereals (451.39%), Ceramic products & glassware (444.45%), Electronic goods (372.62%), Oil meals (279.49%), Cashew (260.48%), Mica, Coal & other ores, minerals including processed minerals (241.21%), Engineering goods (238.27%), Petroleum products (191.53%), Tobacco (187.4%), Cereal preparations & miscellaneous processed items (174.61%), Iron ore (172.16%), Oil seeds (169.04%), Meat, dairy & poultry products (148.81%), Tea (146.31%), Marine products (107.94%), Spices (97.56%), Coffee (75.02%), Organic & inorganic chemicals (68.54%), Rice (61.64%), Plastic & Linoleum (51.89%), Fruits & vegetables (25.4%) and Drugs & pharmaceuticals (23.43%).
- Non-petroleum and Non-Gems and Jewellery exports in April 2021 were USD 23.62 Billion, as compared to USD 9.08 Billion in April 2020, registering a positive growth of 160.24 per cent. As compared to April 2019, Non-petroleum and Non-Gems and Jewellery exports in April 2021registered a positive growth of 20.47 per cent.
IMPORTS
- Imports in April 2021 were USD 45.72 Billion (Rs.3,40,505.06 Crore), which is an increase of 167.05 per cent in Dollar terms and 160.87 per cent in Rupee terms over imports of USD 17.12 Billion (Rs 1,30,525.08 Crore) in April 2020. Imports in April 2021 has registered a positive growth of7.87 per cent in Dollar terms and 15.71 per cent in Rupee terms in comparison to April 2019.
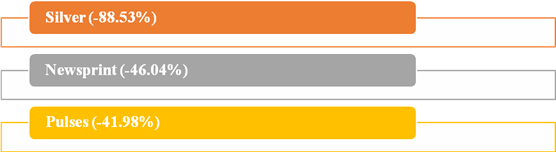
- Major commodity groups of import showing negative growth in April2021 over the corresponding month of last year are:
CRUDE OIL AND NON-OIL IMPORTS:
- Oil imports in April 2021 were USD 10.87 Billion (Rs. 80,968.76 Crore), which was 133.24 percent higher in Dollar terms (127.84 percent higher in Rupee terms), compared to USD 4.66 Billion (Rs. 35,537.22 Crore) in April 2020. As compared to April 2019, oil imports in April 2021 were 5.98percent lower in Dollar terms and 0.85per cent higher in rupee terms.
- In this connection it is mentioned that the global Brent price ($/bbl) has increased by 177.51% in April 2021 vis-à-vis April 2020 as per data available from World Bank.
- Non-oil imports in April 2021 were estimated at USD 34.85 Billion (Rs. 2,59,536.30 Crore) which was 179.70 percent higher in Dollar terms (173.23 percent higher in Rupee terms), compared to USD 12.46 Billion (Rs. 94,987.86 Crore) in April 2020. As compared to April 2019, Non-oil imports in April 2021, were 13.07 per cent higher in Dollar terms and 21.28 per cent higher in Rupee terms.
- Non-Oil and Non-Gold imports were USD 28.61 Billion in April 2021, recording a positive growth of 129.68 per cent, as compared to Non-Oil and Non-Gold imports of USD 12.46Billion in April 2020. Non-Oil and Non-Gold imports in April 2021 recorded a positive growth of 6.56 per cent over April 2019.
II. TRADE IN SERVICES
EXPORTS (Receipts)
- As per the latest press release by RBI dated 14thMay 2021, exports in March 2021 were USD 20.45Billion (Rs.1,48,868.56Crore) registering a positive growth of 12.60per cent in Dollar terms, vis-à-vis March2020. The estimated value of services export for April2021* is USD 21.17Billion.
IMPORTS (Payments)
- As per the latest press release by RBI dated 14th May 2021, imports in March 2021were USD 12.54Billion (Rs. 91,260.33Crore) registering a positive growth of 12.82per cent in Dollar terms, vis-à-vis March 2020. The estimated value of services import for April2021* is USD 13.00Billion.
III.TRADE BALANCE
- MERCHANDISE: The trade deficit for April2021 was estimated at USD15.10Billion as against the deficit of USD6.76Billion inApril2020, which is an increase of 123.17 percent.
- SERVICES: As per RBI’s Press Release dated 14th May 2021, the trade balance in Services (i.e. Net Services export) for March 2021is USD7.91Billion. The estimated trade balance in April 2021* is USD 8.17Billion.
- OVERALL TRADE BALANCE: Taking merchandise and services together, overall trade deficit for April 2021* is estimated at USD6.93Billion as compared to the surplus of USD0.38Billion in April 2020.
*Note: The latest data for services sector released by RBI is for March 2021. The data for April2021 is an estimation, which will be revised based on RBI’s subsequent release.
MERCHANDISE TRADE
SERVICES TRADE
| EXPORTS & IMPORTS (SERVICES) : (US $ Billion) | ||
| (PROVISIONAL) | March 2021 | April-March2020-21 |
| EXPORTS (Receipts) | 20.45 | 205.27 |
| IMPORTS (Payments) | 12.54 | 118.45 |
| TRADE BALANCE | 7.91 | 86.82 |
| EXPORTS & IMPORTS (SERVICES): (Rs. Crore) | ||
| (PROVISIONAL) | March 2021 | April-March 2020-21 |
| EXPORTS (Receipts) | 1,48,868.56 | 15,22,156.97 |
| IMPORTS (Payments) | 91,260.33 | 8,78,061.12 |
| TRADE BALANCE | 57,608.22 | 6,44,095.85 |
| Source: RBI Press Release dated 14th May 2021 | ||
QUICK ESTIMATES FOR SELECTED MAJOR COMMODITIES FOR APRIL 2021