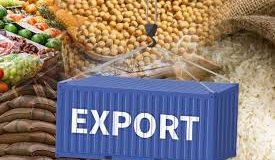
India’s merchandise exports in December 2020 was USD 26.89 billion, as compared to USD 27.11 billion in December 2019, a marginal fall of 0.80%. Exports during April-December 2020-21 were USD 200.55 billion, as compared to USD 238.27 billion during the same period last year, exhibiting a negative growth of 15.8%.
India’s merchandise imports in December 2020 were USD 42.60 billion, as compared to USD 39.59 billion in December 2019, an increase of 7.6%. Merchandise imports during April-December 2020-21 were USD 258.29 billion, as compared to USD 364.18 billion during the same period last year, exhibiting a negative growth of 29.08%.
India is thus a net importer in December 2020, with a trade deficit of USD 15.71 billion, as compared to trade deficit of USD 12.49 billion, widened by 25.78%.
In December 2020, the value of non-petroleum exports was USD 24.73 billion, registering a positive growth of 5.33% over December 2019. The value of non-petroleum and non-gems and jewellery exports in December 2020 was USD 22.15 billion as compared to USD 21.06 billion in December 2019, registering a positivegrowth of 5.17%. The cumulative value of non-petroleum and non-gems and jewellery exports in April-December 2020-21 was USD 166.26 billion, as compared to USD 178.15 billion for the corresponding period in 2019-20, exhibiting a decrease of 6.7%.
In December 2020, Oil imports were USD 9.61 billion, as compared to USD 10.72 billion in December 2019, a decline by 10.37%. Oil imports in April-December 2020-21 were USD 53.71 billion, as compared to USD 96.71 billion, showing a decline of 44.46%.
Non-oil imports in December 2020 were estimated at USD 33.0 billion, as compared to USD 28.88 billion in December 2019, showing an increase of 14.27%. Non-oil imports in April-December 2020-21 were USD 204.57 billion, as compared to USD 267.47 billion, registering a decline of 23.52% during the same period of the last year.
Non-oil, non-GJ (gold, silver &Precious metals) imports were USD 26.10 billion in December 2020, recording a positive growth of 8.42%, as compared to non-oil and non-GJ imports of USD 24.07 billion in December 2019. Non-oil and non-GJ imports were USD 175.29 billion in April-December 2020-21, recording a negative growth of 22.08%, as compared to non-oil and non-GJ imports of USD 224.96 billion in April-December 2019-20.
Major commodities of export which have recorded positive growth during December 2020 vis-à-vis December 2019 are: Other cereals (262.62%), Oil meals (192.60%), Iron ore (69.26%), Cereal preparations and miscellaneous processed item (45.41%), Jute mfg. Including floor covering (21.93%), Handicrafts excl. Hand-made carpet (21.70%), Carpet (21.12%), Ceramic products and glassware (19.11%), Drugs and pharmaceuticals (17.44%), Spices (17.06%), Electronic Goods (16.44%), Fruits and vegetables (12.82%), Organic and Inorganic Chemicals (10.73%), Cotton yarn/fabrics/made-ups, handloom products etc. (10.09%), Rice (8.60%), Meat, dairy and poultry products (6.79%), Gems and Jewellery (6.75%), Mica, coal and other ores, minerals including process (6.02%), Tea (4.47%), Engineering goods (0.12%).
Major commodities of export which have recorded negative growth during December 2020 vis-à-vis December 2019 are Petroleum products (40.47%), Oil Seeds (31.80%), Leather and leather manufactures (17.74%), Coffee (16.39%), RMG of All Textiles (15.07%), Man-made yarn/fabrics/made-ups etc. (14.61%), Marine products (14.27%), Cashew (12.04%), Plastic and linoleum (7.43%), Tobacco (4.95%).
Major commodity groups of import showing positive growth in December 2020 over the corresponding month of last year are: Pulses (245.15%), Sulphur & Unroasted Iron Pyrites (197.41%), Gold (81.82%), Vegetable Oil (43.50%), Chemical material & products (41.51%), Dyeing/tanning/colouring materials (32.64%), Artificial resins, plastic materials, etc. (32.20%), Non-ferrous metals (28.11%), Organic & Inorganic Chemicals (23.30%), Electronic goods (20.90%),Textile yarn Fabric, made-up articles (18.39%), Project Goods (15.27%), Wood & Wood products (14.03%), Machine tools (13.46%), Iron & Steel (12.67%), Pearls, precious & Semi-precious stones (7.81%), Fertilisers, Crude & manufactured (1.42%), Medicinal & Pharmaceutical products (1.2%), Machinery, electrical & non-electrical (0.57%), Fruits & vegetables (0.34%).
Major commodity groups of import showing negative growth in December 2020 over the corresponding month of last year are: Silver (90.52%), Newsprint (76.27%), Leather & leather products (38.93%), Transport equipment (32.05%), Cotton Raw & Waste (28.79%), Metaliferrous ores & other minerals (24.42%),Pulp and Waste paper (12.11%),Petroleum, Crude & products (10.37%), Coal, Coke & Briquettes, etc. (7.27%), Professional instrument, Optical goods, etc. (1.54%).
MERCHANDISE TRADE: Preliminary Data, December 2020
Summary Value in USD Billion
| Total | Non-Petroleum | Non- Petroleum and Non-Gems &Jewellery | ||||||||
| 2019-20 | 2020-21 | % change | 2019-20 | 2020-21 | % change | 2019-20 | 2020-21 | % change | ||
| Exports | 27.11 | 26.89 | -0.80 | 23.48 | 24.73 | 5.33 | 21.06 | 22.15 | 5.17 | |
| Imports | 39.59 | 42.60 | 7.6 | 28.88 | 33.00 | 14.27 | 24.07 | 26.10 | 8.42 | |
| Deficit | -12.48 | -15.71 | -25.88 | -5.4 | -8.27 | -53.15 | -3.01 | -3.95 | -31.23 | |
Change by top Commodity Groups
Value in USD Million
| Top Increase in December 2020 as compared to December 2019 | Top Decline in December 2020 as compared to December 2019 | |||||
| Commodity group | Change in value | % change | Commodity group | Change in value | % change | |
| Export | DRUGS AND PHARMACEUTICALS | 327.27 | 17.44 | PETROLEUM PRODUCTS | -1469.85 | -40.47 |
| ORGANIC AND INORGANIC CHEMICALS | 202.28 | 10.73 | RMG OF ALL TEXTILES | -212.11 | -15.07 | |
| ELECTRONIC GOODS | 176.75 | 16.44 | MARINE PRODUCTS | -93.69 | -14.27 | |
| Import | Gold | 2018.55 | 81.82 | Petroleum, Crude & products | -1111.28 | -10.37 |
| Electronic goods | 870.95 | 20.90 | Transport equipment | -1029.51 | -32.05 | |
| Vegetable Oil | 366.96 | 43.50 | Metaliferrous ores & other minerals | -137.08 | -24.42 | |