-
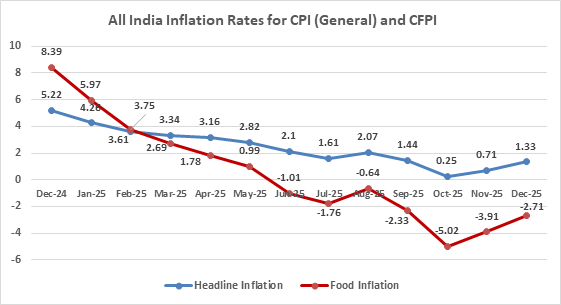
- Headline Inflation: Year-on-year inflation rate based on All India Consumer Price Index (CPI) for the month of December, 2025 over December, 2024 is 1.33% (Provisional). There is an increase of 62 basis points in headline inflation of December, 2025 in comparison to November, 2025.
-
- Food Inflation: Year-on-year inflation rate based on All India Consumer Food Price Index (CFPI) for the month of December, 2025 over December, 2024 is -2.71% (Provisional). Corresponding inflation rates for rural and urban are –3.08% and -2.09%, respectively. An increase of 120 basis points is observed in food inflation in December, 2025 in comparison to November, 2025. All India inflation rates for CPI (General) and CFPI over the last 13 months are shown below.
-
- The increase in headline inflation and food inflation during the month of December, 2025 is mainly attributed to increase in inflation of Personal care and effects, Vegetables, Meat and fish, Egg, Spices and Pulses and Products.
-
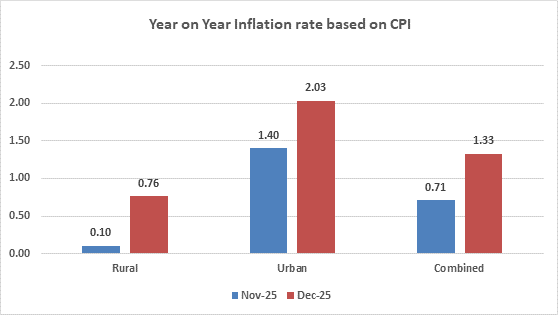
- Rural Inflation: An increase in headline and food inflation in rural sector observed in December, 2025. The headline inflation is 0.76% (Provisional) in December, 2025 while it was 0.10% in November, 2025. The CFPI based food inflation in rural sector is observed as -3.08% (Provisional) in December, 2025 in comparison to -4.05% in November, 2025.
- Urban Inflation: An increase from 1.40% in November, 2025 to 2.03% (Provisional) in December, 2025 is observed in headline inflation of urban sector. Increase is also observed in food inflation from -3.60% in November, 2025 to -2.09% (Provisional) in December, 2025.
- Housing Inflation: Year-on-year Housing inflation rate for the month of December, 2025 is 2.86% (Provisional). Corresponding inflation rate for the month of November, 2025 was 2.95%. The housing index is compiled for urban sector only.
- Education Inflation: Year-on-year Education inflation rate for the month of December, 2025 is 3.32% (Provisional). Corresponding inflation rate for the month of November, 2025 was 3.38%. It is combined education inflation for both rural and urban sector.
- Health Inflation: Year-on-year Health inflation rate for the month of December, 2025 is 3.43% (Provisional). Corresponding inflation rate for the month of November, 2025 was 3.60%. It is combined health inflation for both rural and urban sector.
- Transport & Communication: Year-on-year Transport & communication inflation rate for the month of December, 2025 is 0.76% (Provisional). Corresponding inflation rate for the month of November, 2025 was 0.88%. It is combined inflation rate for both rural and urban sector.
- Fuel & light: Year-on-year Fuel & light inflation rate for the month of December, 2025 is 1.97% (Provisional). Corresponding inflation rate for the month of November, 2025 was 2.32%. It is combined inflation rate for both rural and urban sector.
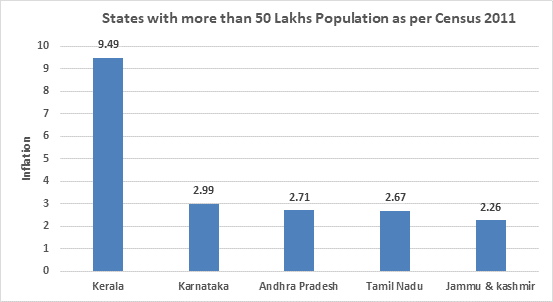
- Top five major states with high Year on Year inflation for the month of December, 2025 are shown in the graph below:
- All India Inflation rates (on point-to-point basis i.e. current month over same month of last year, i.e. December, 2025 over December, 2024), based on General Indices and CFPIs are given as follows:
All India CPI (General), CFPI and corresponding inflation rates (%) for the months of December, 2025 (Provisional), November, 2025 (Final) and December, 2024
| December, 2025 (Prov.) | November, 2025 (Final) | December, 2024 | ||||||||
| Rural | Urban | Combd. | Rural | Urban | Combd. | Rural | Urban | Combd. | ||
| Inflation | CPI (General) | 0.76 | 2.03 | 1.33 | 0.10 | 1.40 | 0.71 | 5.76 | 4.58 | 5.22 |
| CFPI | -3.08 | -2.09 | -2.71 | -4.05 | -3.60 | -3.91 | 8.65 | 7.90 | 8.39 | |
| Index | CPI (General) | 199.9 | 195.9 | 198.0 | 199.6 | 195.9 | 197.9 | 198.4 | 192.0 | 195.4 |
| CFPI | 198.4 | 205.9 | 201.1 | 199.0 | 206.3 | 201.6 | 204.7 | 210.3 | 206.7 | |
Notes: Prov. – Provisional, Combd. – Combined
- Monthly changes in the General Indices and CFPIs are given below:
Monthly changes (%) in All India CPI (General) and CFPI: December, 2025 over November, 2025
| Indices | December, 2025 (Prov.) | November, 2025 (Final) | Monthly change (%) | ||||||
| Rural | Urban | Combd. | Rural | Urban | Combd. | Rural | Urban | Combd. | |
| CPI (General) | 199.9 | 195.9 | 198.0 | 199.6 | 195.9 | 197.9 | 0.15 | 0.00 | 0.05 |
| CFPI | 198.4 | 205.9 | 201.1 | 199.0 | 206.3 | 201.6 | -0.30 | -0.19 | -0.25 |
Notes: Prov. – Provisional, Combd. – Combined
- Response rate: The price data are collected from selected 1114 urban Markets and 1181 villages covering all States/UTs through personal visits by field staff of Field Operations Division of NSO, MoSPI on a weekly roster. During the month of Dec, 2025, NSO collected prices from 100% villages and 98.56% urban markets while the market-wise prices reported therein were 89.36% for rural and 92.71% for urban.
- This is the last release of CPI for base 2012=100. The revised CPI series on base 2024=100 will be released on 12th February, 2026 (Thursday) or the next working day in case of 12th being a holiday.
List of Annexures
| Annex | Title |
| I | All-India General, Group and Sub-group level CPI and CFPI numbers for November, 2025 (Final) and December, 2025 (Provisional) for Rural, Urban and Combined (Annexure I) |
| II | All-India inflation rates (%) for General, Group and Sub-group level CPI and CFPI numbers for December, 2025 (Provisional) for Rural, Urban and Combined (Annexure II) |
| III | General CPI for States for Rural, Urban and Combined for November, 2025 (Final) and December, 2025 (Provisional) (Annexure III) |
| IV | Year-on-year inflation rates (%) of major States for Rural, Urban and Combined for December, 2025 (Provisional) (Annexure IV) |
| V | Year-on-year Inflation rate (%) of key items for November, 2025 (Final) and December, 2025 (Provisional) (Base: 2012=100) (Annexure V) |
| VI | Time Series Data for All India General CPI (Base 2012 =100) Since January, 2013 (Annexure VI) |
| VII | Time Series Data for All India Year-on-year inflation rates (%) based on General CPI (Base 2012=100) Since January, 2014 (Annexure VII) |
For more details, please visit the website www.cpi.mospi.gov.in or esankhyiki.mospi.gov.in or scan the QR code below:

Annexure I
All-India General, Group and Sub-group level CPI and CFPI numbers for November, 2025(Final) and December, 2025 (Provisional) for Rural, Urban and Combined (Base: 2012=100)
| Group Code | Sub-group Code | Description | Rural | Urban | Combined | ||||||||
| Weights | Nov.25
Index |
Dec.25
Index |
Weights | Nov.25
Index |
Dec.25
Index |
Weights | Nov.25
Index |
Dec.25
Index |
|||||
| (1) | (2) | (3) | (4) | (5) | (6) | (7) | (8) | (9) | (10) | (11) | (12) | ||
| 1.1.01 | Cereals and products | 12.35 | 197.4 | 197.2 | 6.59 | 197.8 | 197.7 | 9.67 | 197.5 | 197.4 | |||
| 1.1.02 | Meat and fish | 4.38 | 225.3 | 229.7 | 2.73 | 237.8 | 241.7 | 3.61 | 229.7 | 233.9 | |||
| 1.1.03 | Egg | 0.49 | 207.6 | 220.5 | 0.36 | 211.7 | 224.9 | 0.43 | 209.2 | 222.2 | |||
| 1.1.04 | Milk and products | 7.72 | 191.1 | 191.4 | 5.33 | 193.5 | 193.7 | 6.61 | 192.0 | 192.3 | |||
| 1.1.05 | Oils and fats | 4.21 | 202.4 | 202.6 | 2.81 | 185.0 | 184.8 | 3.56 | 196.0 | 196.1 | |||
| 1.1.06 | Fruits | 2.88 | 205.7 | 203.4 | 2.90 | 204.7 | 203.2 | 2.89 | 205.2 | 203.3 | |||
| 1.1.07 | Vegetables | 7.46 | 201.2 | 194.7 | 4.41 | 247.2 | 241.7 | 6.04 | 216.8 | 210.6 | |||
| 1.1.08 | Pulses and products | 2.95 | 180.4 | 180.2 | 1.73 | 185.0 | 184.8 | 2.38 | 182.0 | 181.8 | |||
| 1.1.09 | Sugar and Confectionery | 1.70 | 136.6 | 136.5 | 0.97 | 138.2 | 138.0 | 1.36 | 137.1 | 137.0 | |||
| 1.1.10 | Spices | 3.11 | 222.3 | 223.5 | 1.79 | 219.8 | 220.4 | 2.50 | 221.5 | 222.5 | |||
| 1.2.11 | Non-alcoholic beverages | 1.37 | 191.0 | 190.8 | 1.13 | 180.5 | 180.3 | 1.26 | 186.6 | 186.4 | |||
| 1.1.12 | Prepared meals, snacks, sweets etc. | 5.56 | 207.5 | 207.8 | 5.54 | 219.0 | 219.7 | 5.55 | 212.8 | 213.3 | |||
| 1 | Food and beverages | 54.18 | 199.7 | 199.2 | 36.29 | 207.5 | 207.2 | 45.86 | 202.6 | 202.1 | |||
| 2 | Pan, tobacco and intoxicants | 3.26 | 213.9 | 214.3 | 1.36 | 219.7 | 219.9 | 2.38 | 215.4 | 215.8 | |||
| 3.1.01 | Clothing | 6.32 | 203.0 | 203.3 | 4.72 | 193.5 | 193.9 | 5.58 | 199.3 | 199.6 | |||
| 3.1.02 | Footwear | 1.04 | 193.4 | 193.0 | 0.85 | 175.1 | 174.7 | 0.95 | 185.8 | 185.4 | |||
| 3 | Clothing and footwear | 7.36 | 201.7 | 201.9 | 5.57 | 190.7 | 191.0 | 6.53 | 197.3 | 197.6 | |||
| 4 | Housing | – | – | – | 21.67 | 188.4 | 186.9 | 10.07 | 188.4 | 186.9 | |||
| 5 | Fuel and light | 7.94 | 184.4 | 185.1 | 5.58 | 174.6 | 175.2 | 6.84 | 180.7 | 181.3 | |||
| 6.1.01 | Household goods and services | 3.75 | 189.3 | 189.8 | 3.87 | 182.5 | 182.6 | 3.80 | 186.1 | 186.4 | |||
| 6.1.02 | Health | 6.83 | 206.5 | 207.0 | 4.81 | 201.0 | 201.3 | 5.89 | 204.4 | 204.8 | |||
| 6.1.03 | Transport and communication | 7.60 | 178.4 | 178.5 | 9.73 | 167.0 | 166.8 | 8.59 | 172.4 | 172.3 | |||
| 6.1.04 | Recreation and amusement | 1.37 | 183.1 | 183.3 | 2.04 | 178.8 | 179.0 | 1.68 | 180.7 | 180.9 | |||
| 6.1.05 | Education | 3.46 | 197.7 | 197.8 | 5.62 | 194.7 | 194.8 | 4.46 | 195.9 | 196.0 | |||
| 6.1.06 | Personal care and effects | 4.25 | 256.1 | 265.1 | 3.47 | 257.3 | 265.1 | 3.89 | 256.6 | 265.1 | |||
| 6 | Miscellaneous | 27.26 | 201.7 | 203.4 | 29.53 | 191.3 | 192.2 | 28.32 | 196.7 | 198.0 | |||
| General Index (All Groups) | 100.00 | 199.6 | 199.9 | 100.00 | 195.9 | 195.9 | 100.00 | 197.9 | 198.0 | ||||
| Consumer Food Price Index (CFPI) | 47.25 | 199.0 | 198.4 | 29.62 | 206.3 | 205.9 | 39.06 | 201.6 | 201.1 | ||||
Notes:
- Prov. : Provisional.
- CFPI : Out of 12 sub-groups contained in ‘Food and Beverages’ group, CFPI is based on ten sub-groups, excluding ‘Non-alcoholic beverages’ and ‘Prepared meals, snacks, sweets etc.’.
3- : CPI (Rural) for housing is not compiled.
Annexure II
All-India year-on-year inflation rates (%) for General, Group and Sub-group level CPI and CFPI numbers for December, 2025 (Provisional) for Rural, Urban and Combined (Base: 2012=100)
| Group Code | Sub-group Code | Description | Rural | Urban | Combined | ||||||||||||||
| Dec. 24 Index (Final) |
Dec. 25
Index |
Inflation Rate (%) |
Dec. 24 Index (Final) |
Dec. 25
Index |
Inflation Rate (%) |
Dec. 24 Index (Final) |
Dec. 25
Index |
Inflation Rate (%) |
|||||||||||
| (1) | (2) | (3) | (4) | (5) | (6) | (7) | (8) | (9) | (10) | (11) | (12) | ||||||||
| 1.1.01 | Cereals and products | 198.9 | 197.2 | -0.85 | 196.5 | 197.7 | 0.61 | 198.1 | 197.4 | -0.35 | |||||||||
| 1.1.02 | Meat and fish | 219.1 | 229.7 | 4.84 | 228.7 | 241.7 | 5.68 | 222.5 | 233.9 | 5.12 | |||||||||
| 1.1.03 | Egg | 209.8 | 220.5 | 5.10 | 215.8 | 224.9 | 4.22 | 212.1 | 222.2 | 4.76 | |||||||||
| 1.1.04 | Milk and products | 187.3 | 191.4 | 2.19 | 187.9 | 193.7 | 3.09 | 187.5 | 192.3 | 2.56 | |||||||||
| 1.1.05 | Oils and fats | 189.0 | 202.6 | 7.20 | 174.6 | 184.8 | 5.84 | 183.7 | 196.1 | 6.75 | |||||||||
| 1.1.06 | Fruits | 189.0 | 203.4 | 7.62 | 192.4 | 203.2 | 5.61 | 190.6 | 203.3 | 6.66 | |||||||||
| 1.1.07 | Vegetables | 242.4 | 194.7 | -19.68 | 289.2 | 241.7 | -16.42 | 258.3 | 210.6 | -18.47 | |||||||||
| 1.1.08 | Pulses and products | 212.4 | 180.2 | -15.16 | 217.4 | 184.8 | -15.00 | 214.1 | 181.8 | -15.09 | |||||||||
| 1.1.09 | Sugar and Confectionery | 130.0 | 136.5 | 5.00 | 132.7 | 138.0 | 3.99 | 130.9 | 137.0 | 4.66 | |||||||||
| 1.1.10 | Spices | 229.0 | 223.5 | -2.40 | 224.1 | 220.4 | -1.65 | 227.4 | 222.5 | -2.15 | |||||||||
| 1.2.11 | Non-alcoholic beverages | 186.7 | 190.8 | 2.20 | 175.5 | 180.3 | 2.74 | 182.0 | 186.4 | 2.42 | |||||||||
| 1.1.12 | Prepared meals, snacks, sweets etc. | 201.2 | 207.8 | 3.28 | 211.7 | 219.7 | 3.78 | 206.1 | 213.3 | 3.49 | |||||||||
| 1 | Food and beverages | 203.9 | 199.2 | -2.31 | 209.4 | 207.2 | -1.05 | 205.9 | 202.1 | -1.85 | |||||||||
| 2 | Pan, tobacco and intoxicants | 208.7 | 214.3 | 2.68 | 212.2 | 219.9 | 3.63 | 209.6 | 215.8 | 2.96 | |||||||||
| 3.1.01 | Clothing | 200.4 | 203.3 | 1.45 | 190.0 | 193.9 | 2.05 | 196.3 | 199.6 | 1.68 | |||||||||
| 3.1.02 | Footwear | 193.7 | 193.0 | -0.36 | 175.6 | 174.7 | -0.51 | 186.2 | 185.4 | -0.43 | |||||||||
| 3 | Clothing and footwear | 199.4 | 201.9 | 1.25 | 187.8 | 191.0 | 1.70 | 194.8 | 197.6 | 1.44 | |||||||||
| 4 | Housing | – | – | – | 181.7 | 186.9 | 2.86 | 181.7 | 186.9 | 2.86 | |||||||||
| 5 | Fuel and light | 182.3 | 185.1 | 1.54 | 170.5 | 175.2 | 2.76 | 177.8 | 181.3 | 1.97 | |||||||||
| 6.1.01 | Household goods and services | 187.0 | 189.8 | 1.50 | 178.3 | 182.6 | 2.41 | 182.9 | 186.4 | 1.91 | |||||||||
| 6.1.02 | Health | 200.2 | 207.0 | 3.40 | 194.5 | 201.3 | 3.50 | 198.0 | 204.8 | 3.43 | |||||||||
| 6.1.03 | Transport and communication | 176.7 | 178.5 | 1.02 | 165.8 | 166.8 | 0.60 | 171.0 | 172.3 | 0.76 | |||||||||
| 6.1.04 | Recreation and amusement | 181.5 | 183.3 | 0.99 | 176.7 | 179.0 | 1.30 | 178.8 | 180.9 | 1.17 | |||||||||
| 6.1.05 | Education | 192.2 | 197.8 | 2.91 | 187.9 | 194.8 | 3.67 | 189.7 | 196.0 | 3.32 | |||||||||
| 6.1.06 | Personal care and effects | 206.3 | 265.1 | 28.50 | 208.0 | 265.1 | 27.45 | 207.0 | 265.1 | 28.07 | |||||||||
| 6 | Miscellaneous | 190.8 | 203.4 | 6.60 | 182.0 | 192.2 | 5.60 | 186.5 | 198.0 | 6.17 | |||||||||
| General Index (All Groups) | 198.4 | 199.9 | 0.76 | 192.0 | 195.9 | 2.03 | 195.4 | 198.0 | 1.33 | ||||||||||
| Consumer Food Price Index | 204.7 | 198.4 | -3.08 | 210.3 | 205.9 | -2.09 | 206.7 | 201.1 | -2.71 | ||||||||||
Notes:
- Prov. : Provisional.
- – : CPI (Rural) for housing is not compiled.
Annexure III
General CPI for States for Rural, Urban and Combined for November, 2025(Final) and December, 2025 (Provisional) (Base: 2012=100)
| Sl. No. | Name of the State/UT | Rural | Urban | Combined | ||||||
| Weights | Nov. 25 Index (Final) |
Dec. 25 Index (Prov.) |
Weights | Nov. 25 Index (Final) |
Dec. 25 Index (Prov.) |
Weights | Nov. 25 Index (Final) |
Dec. 25 Index (Prov.) |
||
| (1) | (2) | (3) | (4) | (5) | (6) | (7) | (8) | (9) | (10) | (11) |
| 1 | Andhra Pradesh | 5.40 | 202.9 | 204.8 | 3.64 | 204.9 | 205.2 | 4.58 | 203.6 | 204.9 |
| 2 | Arunachal Pradesh | 0.14 | 203.0 | 203.2 | 0.06 | — | — | 0.10 | 203.0 | 203.2 |
| 3 | Assam | 2.63 | 197.1 | 196.7 | 0.79 | 198.9 | 197.5 | 1.77 | 197.5 | 196.9 |
| 4 | Bihar | 8.21 | 193.4 | 192.7 | 1.62 | 203.2 | 202.5 | 5.14 | 194.8 | 194.1 |
| 5 | Chhattisgarh | 1.68 | 193.1 | 193.1 | 1.22 | 187.0 | 187.3 | 1.46 | 190.7 | 190.9 |
| 6 | Delhi | 0.28 | 175.9 | 175.6 | 5.64 | 174.8 | 173.4 | 2.77 | 174.9 | 173.5 |
| 7 | Goa | 0.14 | 194.1 | 193.5 | 0.25 | 184.1 | 185.2 | 0.19 | 188.0 | 188.4 |
| 8 | Gujarat | 4.54 | 195.3 | 195.5 | 6.82 | 185.9 | 185.6 | 5.60 | 190.0 | 189.9 |
| 9 | Haryana | 3.30 | 198.5 | 198.6 | 3.35 | 187.8 | 187.7 | 3.32 | 193.5 | 193.5 |
| 10 | Himachal Pradesh | 1.03 | 185.6 | 185.2 | 0.26 | 188.1 | 188.1 | 0.67 | 186.1 | 185.7 |
| 11 | Jharkhand | 1.96 | 191.8 | 191.6 | 1.39 | 198.4 | 198.8 | 1.69 | 194.3 | 194.3 |
| 12 | Karnataka | 5.09 | 205.1 | 205.9 | 6.81 | 207.3 | 207.2 | 5.89 | 206.3 | 206.6 |
| 13 | Kerala | 5.50 | 222.5 | 226.2 | 3.46 | 211.4 | 213.3 | 4.55 | 218.6 | 221.6 |
| 14 | Madhya Pradesh | 4.93 | 194.9 | 195.0 | 3.97 | 197.8 | 197.2 | 4.48 | 196.1 | 195.9 |
| 15 | Maharashtra | 8.25 | 197.1 | 197.0 | 18.86 | 192.3 | 192.4 | 13.18 | 193.9 | 193.9 |
| 16 | Manipur | 0.23 | 226.5 | 226.7 | 0.12 | 192.4 | 190.3 | 0.18 | 215.7 | 215.2 |
| 17 | Meghalaya | 0.28 | 177.7 | 178.2 | 0.15 | 187.6 | 188.0 | 0.22 | 180.8 | 181.2 |
| 18 | Mizoram | 0.07 | 208.2 | 209.3 | 0.13 | 188.0 | 188.7 | 0.10 | 195.9 | 196.7 |
| 19 | Nagaland | 0.14 | 208.3 | 208.2 | 0.12 | 190.5 | 191.2 | 0.13 | 200.7 | 201.0 |
| 20 | Odisha | 2.93 | 201.3 | 201.5 | 1.31 | 193.0 | 193.4 | 2.18 | 199.0 | 199.2 |
| 21 | Punjab | 3.31 | 195.4 | 195.4 | 3.09 | 185.1 | 184.3 | 3.21 | 190.8 | 190.4 |
| 22 | Rajasthan | 6.63 | 193.7 | 194.0 | 4.23 | 192.1 | 192.2 | 5.51 | 193.1 | 193.4 |
| 23 | Sikkim | 0.06 | 207.3 | 207.8 | 0.03 | 193.0 | 192.1 | 0.05 | 202.6 | 202.7 |
| 24 | Tamil Nadu | 5.55 | 206.2 | 208.2 | 9.20 | 205.6 | 207.1 | 7.25 | 205.8 | 207.6 |
| 25 | Telangana | 3.16 | 209.8 | 211.4 | 4.41 | 203.5 | 203.3 | 3.74 | 206.3 | 207.0 |
| 26 | Tripura | 0.35 | 215.4 | 213.4 | 0.14 | 210.7 | 209.4 | 0.25 | 214.2 | 212.4 |
| 27 | Uttar Pradesh | 14.83 | 196.4 | 195.6 | 9.54 | 195.7 | 195.3 | 12.37 | 196.1 | 195.5 |
| 28 | Uttarakhand | 1.06 | 191.2 | 191.2 | 0.73 | 200.4 | 198.8 | 0.91 | 194.6 | 194.0 |
| 29 | West Bengal | 6.99 | 202.1 | 201.2 | 7.20 | 201.4 | 200.2 | 7.09 | 201.8 | 200.7 |
| 30 | Andaman & Nicobar Islands | 0.05 | 205.7 | 205.7 | 0.07 | 196.7 | 195.0 | 0.06 | 201.1 | 200.3 |
| 31 | Chandigarh | 0.02 | 195.3 | 195.2 | 0.34 | 182.5 | 182.3 | 0.17 | 183.2 | 183.0 |
| 32 | Dadra & Nagar Haveli | 0.02 | 179.2 | 179.5 | 0.04 | 191.5 | 193.2 | 0.03 | 187.4 | 188.6 |
| 33 | Daman & Diu | 0.02 | 204.9 | 204.7 | 0.02 | 192.5 | 194.4 | 0.02 | 199.7 | 200.4 |
| 34 | Jammu & Kashmir* | 1.14 | 210.9 | 210.9 | 0.72 | 204.3 | 203.3 | 0.94 | 208.6 | 208.2 |
| 35 | Lakshadweep | 0.01 | 209.3 | 208.4 | 0.01 | 210.2 | 209.4 | 0.01 | 209.8 | 208.9 |
| 36 | Puducherry | 0.08 | 213.1 | 215.4 | 0.27 | 203.9 | 204.5 | 0.17 | 206.2 | 207.3 |
| All India | 100.00 | 199.6 | 199.9 | 100.00 | 195.9 | 195.9 | 100.00 | 197.9 | 198.0 | |
Notes:
- Prov.: Provisional
- –: indicates the receipt of price schedules is less than 80% of allocated schedules and therefore indices are not compiled.
- *: Figures of this row pertain to the prices and weights of the combined Union Territories of Jammu & Kashmir
and Ladakh (erstwhile State of Jammu & Kashmir).
Annexure IV
Year-on-year inflation rates (%) of major@ States for Rural, Urban and Combined for December, 2025 (Provisional) (Base: 2012=100)
| Sl. No. | Name of the State/UT | Rural | Urban | Combined | ||||||
| Dec. 24 Index (Final) |
Dec. 25
Index |
Inflation Rate (%) |
Dec. 24 Index (Final) |
Dec. 25
Index |
Inflation Rate (%) |
Dec. 24 Index (Final) |
Dec. 25
Index |
Inflation Rate (%) |
||
| (1) | (2) | (3) | (4) | (5) | (6) | (7) | (8) | (9) | (10) | (11) |
| 1 | Andhra Pradesh | 199.5 | 204.8 | 2.66 | 199.4 | 205.2 | 2.91 | 199.5 | 204.9 | 2.71 |
| 2 | Assam | 200.1 | 196.7 | -1.70 | 196.7 | 197.5 | 0.41 | 199.4 | 196.9 | -1.25 |
| 3 | Bihar | 195.7 | 192.7 | -1.53 | 203.1 | 202.5 | -0.30 | 196.8 | 194.1 | -1.37 |
| 4 | Chhattisgarh | 193.1 | 193.1 | 0.00 | 185.9 | 187.3 | 0.75 | 190.3 | 190.9 | 0.32 |
| 5 | Delhi | 176.5 | 175.6 | -0.51 | 171.2 | 173.4 | 1.29 | 171.5 | 173.5 | 1.17 |
| 6 | Gujarat | 193.4 | 195.5 | 1.09 | 182.8 | 185.6 | 1.53 | 187.4 | 189.9 | 1.33 |
| 7 | Haryana | 200.3 | 198.6 | -0.85 | 186.3 | 187.7 | 0.75 | 193.7 | 193.5 | -0.10 |
| 8 | Himachal Pradesh | 182.9 | 185.2 | 1.26 | 187.4 | 188.1 | 0.37 | 183.7 | 185.7 | 1.09 |
| 9 | Jharkhand | 191.5 | 191.6 | 0.05 | 193.6 | 198.8 | 2.69 | 192.3 | 194.3 | 1.04 |
| 10 | Karnataka | 200.2 | 205.9 | 2.85 | 200.9 | 207.2 | 3.14 | 200.6 | 206.6 | 2.99 |
| 11 | Kerala | 204.2 | 226.2 | 10.77 | 199.1 | 213.3 | 7.13 | 202.4 | 221.6 | 9.49 |
| 12 | Madhya Pradesh | 196.6 | 195.0 | -0.81 | 196.0 | 197.2 | 0.61 | 196.4 | 195.9 | -0.25 |
| 13 | Maharashtra | 196.3 | 197.0 | 0.36 | 188.2 | 192.4 | 2.23 | 190.9 | 193.9 | 1.57 |
| 14 | Odisha | 204.9 | 201.5 | -1.66 | 191.8 | 193.4 | 0.83 | 201.2 | 199.2 | -0.99 |
| 15 | Punjab | 191.3 | 195.4 | 2.14 | 181.8 | 184.3 | 1.38 | 187.0 | 190.4 | 1.82 |
| 16 | Rajasthan | 193.6 | 194.0 | 0.21 | 191.3 | 192.2 | 0.47 | 192.8 | 193.4 | 0.31 |
| 17 | Tamil Nadu | 204.2 | 208.2 | 1.96 | 200.8 | 207.1 | 3.14 | 202.2 | 207.6 | 2.67 |
| 18 | Telangana | 207.3 | 211.4 | 1.98 | 200.2 | 203.3 | 1.55 | 203.4 | 207.0 | 1.77 |
| 19 | Uttar Pradesh | 198.5 | 195.6 | -1.46 | 193.8 | 195.3 | 0.77 | 196.8 | 195.5 | -0.66 |
| 20 | Uttarakhand | 190.8 | 191.2 | 0.21 | 195.8 | 198.8 | 1.53 | 192.7 | 194.0 | 0.67 |
| 21 | West Bengal | 201.9 | 201.2 | -0.35 | 195.1 | 200.2 | 2.61 | 198.7 | 200.7 | 1.01 |
| 22 | Jammu & Kashmir* | 205.8 | 210.9 | 2.48 | 199.6 | 203.3 | 1.85 | 203.6 | 208.2 | 2.26 |
| All India | 198.4 | 199.9 | 0.76 | 192.0 | 195.9 | 2.03 | 195.4 | 198.0 | 1.33 | |
Notes:
- Prov. : Provisional.
- * : Figures of this row pertain to the prices and weights of the combined Union Territories of Jammu &Kashmir and Ladakh (erstwhile State of Jammu & Kashmir).
- @ : States having population more than 50 lakhs as per Population Census 2011.
Annexure V
Year -on-year inflation rate (%) of key items for November, 2025 (Final) and December,2025 (Provisional) (Base: 2012=100)
| S.No. | Item Description | All India (Combined) | ||||||
| Weights | Nov. 24 Index (Final) | Dec. 24 Index (Final) | Nov. 25 Index (Final) | Dec. 25 Index (Prov.) | Nov. 25 (Final) Inflation rate (%) | Dec. 25 (Prov.) Inflation rate (%) | ||
| (1) | (2) | (3) | (4) | (5) | (6) | (7) | (8) | (9) |
| 1 | Milk: liquid | 6.42 | 187.3 | 187.5 | 192.0 | 192.2 | 2.51 | 2.51 |
| 2 | Rice – Other Sources | 4.38 | 198.6 | 198.6 | 196.4 | 196.1 | -1.11 | -1.26 |
| 3 | Wheat/atta – other sources | 2.56 | 209.4 | 211.9 | 210.1 | 210.5 | 0.33 | -0.66 |
| 4 | Electricity | 2.26 | 162.2 | 162.3 | 164.3 | 164.9 | 1.29 | 1.60 |
| 5 | Mustard Oil | 1.33 | 179.1 | 179.9 | 194.9 | 194.7 | 8.82 | 8.23 |
| 6 | Fish, Prawn | 1.27 | 206.1 | 206.4 | 212.8 | 216.6 | 3.25 | 4.94 |
| 7 | Refined Oil [sunflower, soyabean, saffola, etc.] | 1.26 | 172.3 | 176.0 | 182.0 | 182.9 | 5.63 | 3.92 |
| 8 | Chicken | 1.23 | 222.2 | 216.9 | 223.0 | 230.4 | 0.36 | 6.22 |
| 9 | Sugar – Other Sources | 1.13 | 126.2 | 125.4 | 131.6 | 131.5 | 4.28 | 4.86 |
| 10 | Gold | 1.08 | 257.5 | 257.2 | 408.4 | 433.8 | 58.60 | 68.66 |
| 11 | Potato | 0.98 | 279.1 | 265.3 | 186.9 | 172.7 | -33.03 | -34.90 |
| 12 | Tea: leaf | 0.96 | 185.0 | 185.8 | 189.0 | 188.7 | 2.16 | 1.56 |
| 13 | Biscuits, Chocolates, etc. | 0.88 | 159.7 | 160.1 | 165.1 | 164.7 | 3.38 | 2.87 |
| 14 | Arhar, Tur | 0.80 | 254.0 | 250.0 | 179.1 | 178.8 | -29.49 | -28.48 |
| 15 | Goat Meat/Mutton | 0.79 | 249.7 | 250.5 | 259.4 | 260.8 | 3.88 | 4.11 |
| 16 | motor cycle, scooter | 0.79 | 192.2 | 192.6 | 187.9 | 187.8 | -2.24 | -2.49 |
| 17 | Onion | 0.64 | 439.9 | 387.6 | 196.3 | 201.4 | -55.38 | -48.04 |
| 18 | domestic servant/cook | 0.64 | 204.2 | 204.3 | 211.9 | 212.3 | 3.77 | 3.92 |
| 19 | Tomato | 0.57 | 270.3 | 227.0 | 236.1 | 259.4 | -12.65 | 14.27 |
| 20 | Ghee | 0.47 | 197.1 | 197.4 | 203.4 | 203.9 | 3.20 | 3.29 |
| 21 | Eggs | 0.43 | 201.4 | 212.1 | 209.2 | 222.2 | 3.87 | 4.76 |
| 22 | Jeera | 0.37 | 246.1 | 242.3 | 211.3 | 209.9 | -14.14 | -13.37 |
| 23 | Silver | 0.11 | 182.4 | 180.9 | 302.2 | 356.5 | 65.68 | 97.07 |
| 24 | PC/Laptop/other peripherals incl. software | 0.11 | 154.8 | 154.9 | 156.1 | 156.2 | 0.84 | 0.84 |
| 25 | Coconut: copra | 0.10 | 220.0 | 224.5 | 355.2 | 357.7 | 61.45 | 59.33 |
| 26 | Gram: whole | 0.09 | 205.0 | 204.6 | 183.9 | 183.6 | -10.29 | -10.26 |
| 27 | Curd | 0.09 | 189.3 | 189.6 | 193.4 | 193.4 | 2.17 | 2.00 |
| 28 | Refrigerator | 0.09 | 151.4 | 151.5 | 149.3 | 148.7 | -1.39 | -1.85 |
| 29 | Coconut oil | 0.08 | 286.4 | 298.2 | 494.2 | 482.2 | 72.56 | 61.70 |
| 30 | Cashewnut | 0.08 | 170.1 | 171.8 | 177.2 | 177.3 | 4.17 | 3.20 |
Note:
- Prov.: Provisional
Annexure VI
Time Series Data for All India General CPI (Base 2012 =100) Since January, 2013
| Year | Jan | Feb | Mar | Apr | May | Jun | Jul | Aug | Sep | Oct | Nov | Dec |
| 2013 | 104.6 | 105.3 | 105.5 | 106.1 | 106.9 | 109.3 | 111.0 | 112.4 | 113.7 | 114.8 | 116.3 | 114.5 |
| 2014 | 113.6 | 113.6 | 114.2 | 115.1 | 115.8 | 116.7 | 119.2 | 120.3 | 120.1 | 120.1 | 120.1 | 119.4 |
| 2015 | 119.5 | 119.7 | 120.2 | 120.7 | 121.6 | 123.0 | 123.6 | 124.8 | 125.4 | 126.1 | 126.6 | 126.1 |
| 2016 | 126.3 | 126.0 | 126.0 | 127.3 | 128.6 | 130.1 | 131.1 | 131.1 | 130.9 | 131.4 | 131.2 | 130.4 |
| 2017 | 130.3 | 130.6 | 130.9 | 131.1 | 131.4 | 132.0 | 134.2 | 135.4 | 135.2 | 136.1 | 137.6 | 137.2 |
| 2018 | 136.9 | 136.4 | 136.5 | 137.1 | 137.8 | 138.5 | 139.8 | 140.4 | 140.2 | 140.7 | 140.8 | 140.1 |
| 2019 | 139.6 | 139.9 | 140.4 | 141.2 | 142.0 | 142.9 | 144.2 | 145.0 | 145.8 | 147.2 | 148.6 | 150.4 |
| 2020 | 150.2 | 149.1 | 148.6 | 151.4 | 150.9 | 151.8 | 153.9 | 154.7 | 156.4 | 158.4 | 158.9 | 157.3 |
| 2021 | 156.3 | 156.6 | 156.8 | 157.8 | 160.4 | 161.3 | 162.5 | 162.9 | 163.2 | 165.5 | 166.7 | 166.2 |
| 2022 | 165.7 | 166.1 | 167.7 | 170.1 | 171.7 | 172.6 | 173.4 | 174.3 | 175.3 | 176.7 | 176.5 | 175.7 |
| 2023 | 176.5 | 176.8 | 177.2 | 178.1 | 179.1 | 181.0 | 186.3 | 186.2 | 184.1 | 185.3 | 186.3 | 185.7 |
| 2024 | 185.5 | 185.8 | 185.8 | 186.7 | 187.7 | 190.2 | 193.0 | 193.0 | 194.2 | 196.8 | 196.5 | 195.4 |
| 2025 | 193.4 | 192.5 | 192.0 | 192.6 | 193.0 | 194.2 | 196.1 | 197.0 | 197.0 | 197.3 | 197.9 | 198.0* |
Notes:
- *: Index Value for December 2025 is Provisional.
Annexure VII
Time Series Data for All India Year-on-year inflation rates (%) based on General CPI (Base 2012=100) Since January, 2014
| Year | Jan | Feb | Mar | Apr | May | Jun | Jul | Aug | Sep | Oct | Nov | Dec |
| 2014 | 8.60 | 7.88 | 8.25 | 8.48 | 8.33 | 6.77 | 7.39 | 7.03 | 5.63 | 4.62 | 3.27 | 4.28 |
| 2015 | 5.19 | 5.37 | 5.25 | 4.87 | 5.01 | 5.40 | 3.69 | 3.74 | 4.41 | 5.00 | 5.41 | 5.61 |
| 2016 | 5.69 | 5.26 | 4.83 | 5.47 | 5.76 | 5.77 | 6.07 | 5.05 | 4.39 | 4.20 | 3.63 | 3.41 |
| 2017 | 3.17 | 3.65 | 3.89 | 2.99 | 2.18 | 1.46 | 2.36 | 3.28 | 3.28 | 3.58 | 4.88 | 5.21 |
| 2018 | 5.07 | 4.44 | 4.28 | 4.58 | 4.87 | 4.92 | 4.17 | 3.69 | 3.70 | 3.38 | 2.33 | 2.11 |
| 2019 | 1.97 | 2.57 | 2.86 | 2.99 | 3.05 | 3.18 | 3.15 | 3.28 | 3.99 | 4.62 | 5.54 | 7.35 |
| 2020 | 7.59 | 6.58 | 5.84 | – | – | 6.23 | 6.73 | 6.69 | 7.27 | 7.61 | 6.93 | 4.59 |
| 2021 | 4.06 | 5.03 | 5.52 | 4.23 | 6.30 | 6.26 | 5.59 | 5.30 | 4.35 | 4.48 | 4.91 | 5.66 |
| 2022 | 6.01 | 6.07 | 6.95 | 7.79 | 7.04 | 7.01 | 6.71 | 7.00 | 7.41 | 6.77 | 5.88 | 5.72 |
| 2023 | 6.52 | 6.44 | 5.66 | 4.70 | 4.31 | 4.87 | 7.44 | 6.83 | 5.02 | 4.87 | 5.55 | 5.69 |
| 2024 | 5.10 | 5.09 | 4.85 | 4.83 | 4.80 | 5.08 | 3.60 | 3.65 | 5.49 | 6.21 | 5.48 | 5.22 |
| 2025 | 4.26 | 3.61 | 3.34 | 3.16 | 2.82 | 2.10 | 1.61 | 2.07 | 1.44 | 0.25 | 0.71 | 1.33* |
Notes:
- *: Inflation Value for December 2025 is Provisional.
- -: Inflation was not compiled and released due to Covid-19 pandemic outbreak.