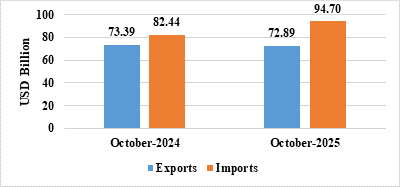
India’s total exports (Merchandise and Services combined) for October 2025* is estimated at US$ 72.89 Billion, registering a negative growth of (-) 0.68 percent vis-à-vis October 2024. Total imports (Merchandise and Services combined) for October 2025* is estimated at US$ 94.70 Billion, registering a positive growth of 14.87 percent vis-à-vis October 2024.
Table 1: Trade during October 2025*
| October 2025
(US$ Billion) |
October 2024
(US$ Billion) |
||
| Merchandise | Exports | 34.38 | 38.98 |
| Imports | 76.06 | 65.21 | |
| Services* | Exports | 38.52 | 34.41 |
| Imports | 18.64 | 17.23 | |
| Total Trade
(Merchandise +Services) * |
Exports | 72.89 | 73.39 |
| Imports | 94.70 | 82.44 | |
| Trade Balance | -21.80 | -9.05 |
* Note: The latest data for services sector released by RBI is for September 2025. The data for October 2025 is an estimation. (ii) Data for April-October 2024 and April-June 2025 has been revised on pro-rata basis using quarterly balance of payments data.
Fig 1: Total Trade during October 2025*
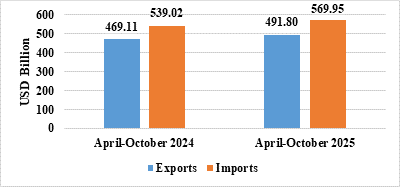
India’s total exports during April-October 2025* is estimated at US$ 491.80 Billion registering a positive growth of 4.84 percent. Total imports during April-October 2025* is estimated at US$ 569.95 Billion registering a growth of 5.74 percent.
Table 2: Trade during April-October 2025*
| April-October 2025
(US$ Billion) |
April-October 2024
(US$ Billion) |
||
| Merchandise | Exports | 254.25 | 252.66 |
| Imports | 451.08 | 424.06 | |
| Services* | Exports | 237.55 | 216.45 |
| Imports | 118.87 | 114.96 | |
| Total Trade
(Merchandise +Services) * |
Exports | 491.80 | 469.11 |
| Imports | 569.95 | 539.02 | |
| Trade Balance | -78.14 | -69.92 |
Fig 2: Total Trade during April-October 2025*
MERCHANDISE TRADE
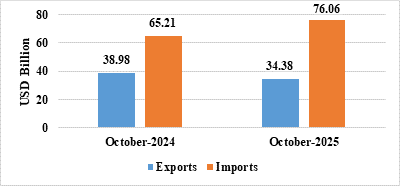
- Merchandise exports during October 2025 were US$ 34.38 Billion as compared to US$ 38.98 Billion in October 2024.
- Merchandise imports during October 2025 were US$ 76.06 Billion as compared to US$ 65.21 Billion in October 2024.
Fig 3: Merchandise Trade during October 2025
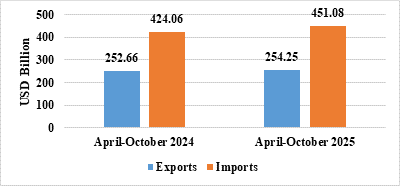
- Merchandise exports during April-October 2025 were US$ 254.25 Billion as compared to US$ 252.66 Billion during April-October 2024.
- Merchandise imports during April-October 2025 were US$ 451.08 Billion as compared to US$ 424.06 Billion during April-October 2024.
- Merchandise trade deficit during April-October 2025 was US$ 196.82 Billion as compared to US$ 171.40 Billion during April-October 2024.
Fig 4: Merchandise Trade during April-October 2025
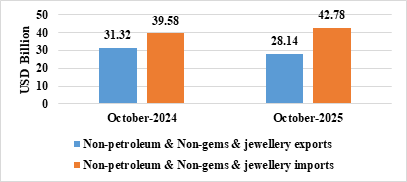
- Non-petroleum and non-gems & jewellery exports in October 2025 were US$ 28.14 Billion compared to US$ 31.32 Billion in October 2024.
- Non-petroleum, non-gems & jewellery (gold, silver & precious metals) imports in October 2025 were US$ 42.78 Billion compared to US$ 39.58 Billion in October 2024.
Table 3: Trade excluding Petroleum and Gems & Jewellery during October 2025
October 2025(US$ Billion) |
October 2024
(US$ Billion) |
|
| Non- petroleum exports | 30.43 | 34.57 |
| Non- petroleum imports | 61.27 | 46.33 |
| Non-petroleum & Non-Gems & Jewellery exports | 28.14 | 31.32 |
| Non-petroleum & Non-Gems & Jewellery imports | 42.78 | 39.58 |
Note: Gems & Jewellery Imports include Gold, Silver & Pearls, precious & Semi-precious stones
Fig 5: Trade excluding Petroleum and Gems & Jewellery during October 2025
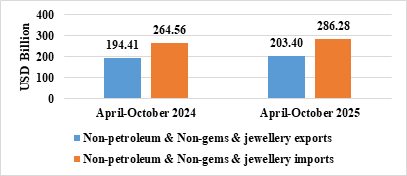
- Non-petroleum and non-gems & jewellery exports in April-October 2025 were US$ 203.40 Billion, compared to US$ 194.41 Billion in April-October 2024.
- Non-petroleum, non-gems & jewellery (gold, silver & precious metals) imports in April-October 2025 were US$ 286.28 Billion, compared to US$ 264.56 Billion in April-October 2024.
Table 4: Trade excluding Petroleum and Gems & Jewellery during April-October 2025
April-October 2025(US$ Billion) |
April-October 2024
(US$ Billion) |
|
| Non- petroleum exports | 219.90 | 211.60 |
| Non- petroleum imports | 344.17 | 312.13 |
| Non-petroleum & Non Gems & Jewellery exports | 203.40 | 194.41 |
| Non-petroleum & Non Gems & Jewellery imports | 286.28 | 264.56 |
Note: Gems & Jewellery Imports include Gold, Silver & Pearls, precious & Semi-precious stones
Fig 6: Trade excluding Petroleum and Gems & Jewellery during April-October 2025
SERVICES TRADE
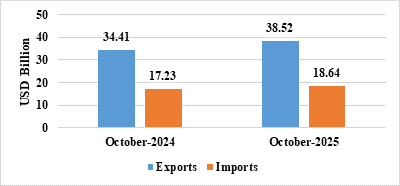
- The estimated value of services export for October 2025* is US$ 38.52 Billion as compared to US$ 34.41 Billion in October 2024.
- The estimated value of services imports for October 2025* is US$ 18.64 Billion as compared to US$ 17.23 Billion in October 2024.
Fig 7: Services Trade during October 2025*
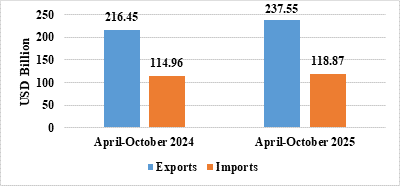
- The estimated value of service exports during April-October 2025* is US$ 237.55 Billion as compared to US$ 216.45 Billion in April-October 2024.
- The estimated value of service imports during April-October 2025* is US$ 118.87 Billion as compared to US$ 114.96 Billion in April-October 2024.
- The services trade surplus for April-October 2025* is US$ 118.68 Billion as compared to US$ 101.49 Billion in April-October 2024.
Fig 8: Services Trade during April-October 2025*
- Exports of Cashew (126.85%), Meat, Dairy & Poultry Products (30.87%), Electronic Goods (19.05%), Other Cereals (14.71%), Marine Products (11.08%) and Coffee (10.91%) record positive growth during October 2025 over the corresponding month of last year.
- Imports of Pearls, Precious & Semi-Precious Stones (-25.35%), Petroleum, Crude & Products (-21.65%), Pulp And Waste Paper (-21.34%), Iron & Steel (-19.32%), Newsprint (-18.28%), Pulses (-16.42%), Coal, Coke & Briquettes, Etc. (-4.21%), Artificial Resins, Plastic Materials, Etc. (-3.55%), Wood & Wood Products (-2.42%), Textile Yarn Fabric, Made-Up Articles (-1.17%) and Organic & Inorganic Chemicals (-0.11%) record negative growth during October 2025 over the corresponding month of last year.
- Services exports is estimated to grow by 9.75 percent during April-October 2025* over April-October 2024.
- Top 5 export destinations, in terms of change in value, exhibiting positive growth in October 2025 vis a vis October 2024 are China P Rp (42.35%), Spain (43.43%), Sri Lanka Dsr (29.02%), Vietnam Soc Rep (21.42%) and Tanzania Rep (17.92%).
- Top 5 export destinations, in terms of change in value, exhibiting positive growth in April-October 2025 vis a vis April-October 2024 are U S A (10.15%), China P Rp (24.77%), U Arab Emts (5.88%), Spain (40.74%) and Hong Kong (20.7%).
- Top 5 import sources, in terms of change in value, exhibiting growth in October 2025 vis a vis October 2024 are Switzerland (403.67%), Hong Kong (93.98%), China P Rp (15.63%), U K (194.41%) and U Arab Emts (14.38%).
- Top 5 import sources, in terms of change in value, exhibiting growth in April-October 2025 vis a vis April-October 2024 are China P Rp (11.88%), U Arab Emts (13.43%), Hong Kong (31.38%), Ireland (169.44%) and U S A (9.73%).