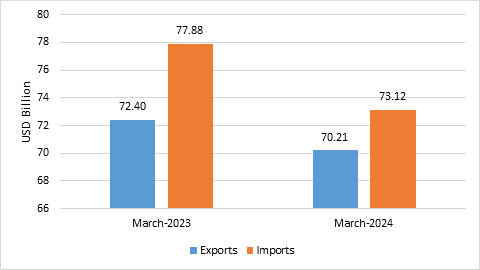
- India’s overall exports (Merchandise and Services combined) in March 2024* is estimated to be USD 70.21 Billion, exhibiting a negative growth of (-) 3.01 per cent over March 2023. Overall imports in March 2024* is estimated to be USD 73.12 Billion, exhibiting a negative growth of (-) 6.11 per cent over March 2023.
Table 1: Trade during March 2024*
| March 2024
(USD Billion) |
March 2023
(USD Billion) |
||
| Merchandise | Exports | 41.68 | 41.96 |
| Imports | 57.28 | 60.92 | |
| Services* | Exports | 28.54 | 30.44 |
| Imports | 15.84 | 16.96 | |
| Overall Trade
(Merchandise +Services) * |
Exports | 70.21 | 72.40 |
| Imports | 73.12 | 77.88 | |
| Trade Balance | -2.91 | -5.48 |
* Note: The latest data for services sector released by RBI is for February 2024. The data for March 2024 is an estimation, which will be revised based on RBI’s subsequent release. (ii) Data for FY 2022-23 (April-March) and April-December 2023 has been revised on pro-rata basis using quarterly balance of payments data.
Fig 1: Overall Trade during March 2024*
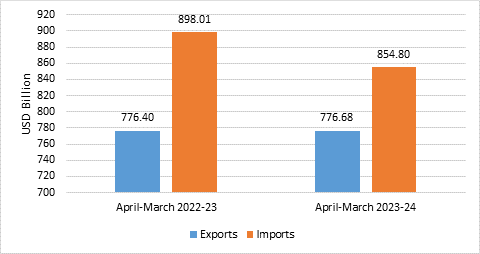
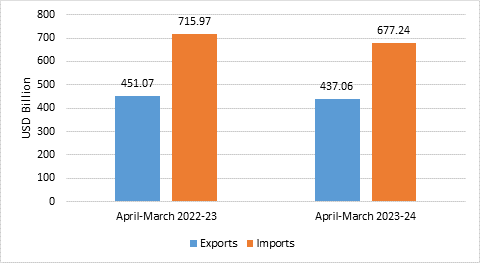
- India’s overall exports (Merchandise and Services combined) in FY 2023-24 (April-March)* are estimated to be USD 776.68 Billion, exhibiting a positive growth of 0.04 per cent over FY 2022-23 (April-March). Overall imports in FY 2023-24 (April-March)* are estimated to be USD 854.80 Billion, exhibiting a negative growth of (-) 4.81 per cent over FY 2022-23 (April-March).
Table 2: Trade during FY 2023-24 (April-March)*
| 2023-24
(USD Billion) |
2022-23
(USD Billion) |
||
| Merchandise | Exports | 437.06 | 451.07 |
| Imports | 677.24 | 715.97 | |
| Services* | Exports | 339.62 | 325.33 |
| Imports | 177.56 | 182.05 | |
| Overall Trade
(Merchandise+ Services)* |
Exports | 776.68 | 776.40 |
| Imports | 854.80 | 898.01 | |
| Trade Balance | -78.12 | -121.62 |
Fig 2: Overall Trade during FY 2023-24 (April-March)*
MERCHANDISE TRADE
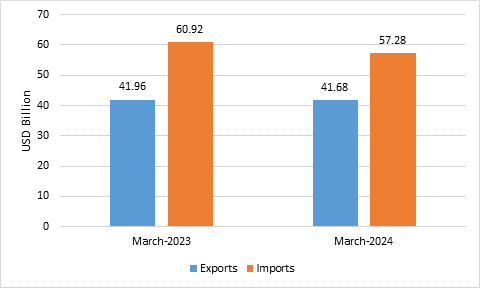
- Merchandise exports in March 2024 were USD 41.68 Billion, as compared to USD 41.96 Billion in March 2023.
- Merchandise imports in March 2024 were USD 57.28 Billion, as compared to USD 60.92 Billion in March 2023.
Fig 3: Merchandise Trade during March 2024
- Merchandise exports for the period FY 2023-24 (April-March) were USD 437.06 Billion as against USD 451.07 Billion during FY 2022-23 (April-March).
- Merchandise imports for the period FY 2023-24 (April-March) were USD 677.24 Billion as against USD 715.97 Billion during FY 2022-23 (April-March).
- The merchandise trade deficit for FY 2023-24 (April-March) was estimated at USD 240.17 Billion as against USD 264.90 Billion during FY 2022-23 (April-March).
Fig 4: Merchandise Trade during FY 2023-24 (April-March)
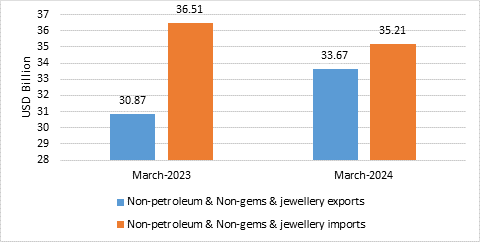
- Non-petroleum and non-gems & jewellery exports in March 2024 were USD 33.67 Billion, compared to USD 30.87 Billion in March 2023.
- Non-petroleum, non-gems & jewellery (gold, silver & precious metals) imports in March 2024 were USD 35.21 Billion, compared to USD 36.51 Billion in March 2023.
Table 3: Trade excluding Petroleum and Gems & Jewellery during March 2024
March 2024(USD Billion) |
March 2023
(USD Billion) |
|
| Non- petroleum exports | 36.29 | 33.61 |
| Non- petroleum imports | 40.05 | 42.90 |
| Non-petroleum & Non Gems & Jewellery exports | 33.67 | 30.87 |
| Non-petroleum & Non Gems & Jewellery imports | 35.21 | 36.51 |
Note: Gems & Jewellery Imports include Gold, Silver & Pearls, precious & Semi-precious stones
Fig 5: Trade excluding Petroleum and Gems & Jewellery during March 2024
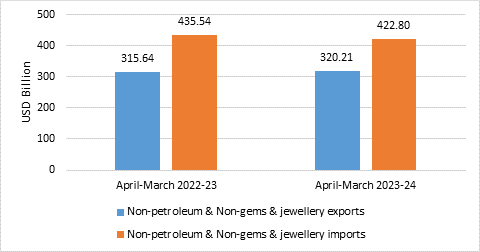
- Non-petroleum and non-gems & jewellery exports during FY 2023-24 (April-March) was USD 320.21 Billion, as compared to USD 315.64 Billion in FY 2022-23 (April-March).
- Non-petroleum, non-gems & jewellery (gold, silver & precious metals) imports were USD 422.80 Billion in FY 2023-24 (April-March) as compared to USD 435.54 Billion in FY 2022-23 (April-March).
Table 4: Trade excluding Petroleum and Gems & Jewellery during FY 2023-24 (April-March)
| 2023-24
(USD Billion) |
2022-23
(USD Billion) |
|
| Non- petroleum exports | 352.92 | 353.60 |
| Non- petroleum imports | 497.62 | 506.55 |
| Non-petroleum & Non Gems & Jewellery exports | 320.21 | 315.64 |
| Non-petroleum & Non Gems & Jewellery imports | 422.80 | 435.54 |
Note: Gems & Jewellery Imports include Gold, Silver & Pearls, precious & Semi-precious stones
Fig 6: Trade excluding Petroleum and Gems & Jewellery during FY 2023-24 (April-March)
SERVICES TRADE
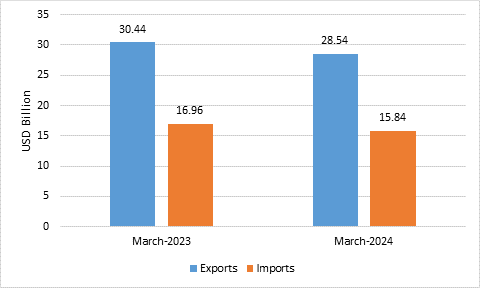
- The estimated value of services export for March 2024* is USD 28.54 Billion, as compared to USD 30.44 Billion in March 2023.
- The estimated value of services import for March 2024* is USD 15.84 Billion as compared to USD 16.96 Billion in March 2023.
Fig 7: Services Trade during March 2024*
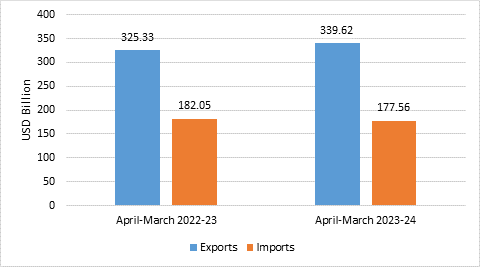
- The estimated value of services export for FY 2023-24 (April-March)* is USD 339.62 Billion as compared to USD 325.33 Billion in FY 2022-23 (April-March).
- The estimated value of services imports for FY 2023-24 (April-March)* is USD 177.56 Billion as compared to USD 182.05 Billion in FY 2022-23 (April-March).
- The services trade surplus for FY 2023-24 (April-March)* is estimated at USD 162.05 Billion as against USD 143.28 Billion in FY 2022-23 (April-March).
Fig 8: Services Trade during FY 2023-24 (April-March)*
- For the month of March 2024, under merchandise exports, 17 of the 30 key sectors exhibited positive growth in March 2024 as compared to same period last year (March 2023). These include Handicrafts Excl. Hand Made Carpet (128.39%), Spices (51.01%), Coffee (40.3%), Organic & Inorganic Chemicals (39.67%), Tobacco (35.81%), Tea (27.05%), Electronic Goods (23.12%), Carpet (16.23%), Drugs & Pharmaceuticals (12.73%), Plastic & Linoleum (11.16%), Engineering Goods (10.66%), Meat, Dairy & Poultry Products (8.72%), Cereal Preparations & Miscellaneous Processed Items (8.23%), Cotton Yarn/Fabs./Made-Ups, Handloom Products Etc. (6.78%), Fruits & Vegetables (2.92%), RMG Of All Textiles (1.7%) and Ceramic Products & Glassware (0.22%).
- Under merchandise imports, 18 out of 30 key sectors exhibited negative growth in March 2024. These include Gold (-53.56%), Newsprint (-36.42%), Fertilisers, Crude & Manufactured (-36.23%), Leather & Leather Products (-25.67%), Vegetable Oil (-24.29%), Metaliferrous Ores & Other Minerals (-22.15%), Chemical Material & Products (-20.26%), Artificial Resins, Plastic Materials, Etc. (-19.87%), Organic & Inorganic Chemicals (-19.29%), Pearls, Precious & Semi-Precious Stones (-17.69%), Textile Yarn Fabric, Made-Up Articles (-12.17%), Cotton Raw & Waste (-11.29%), Transport Equipment (-10.7%), Iron & Steel (-10.1%), Wood & Wood Products (-9.84%), Coal, Coke & Briquettes, Etc. (-6.6%), Petroleum, Crude & Products (-4.4%) and Medicinal & Pharmaceutical Products (-2.85%).
- For FY 2023-24 (April-March), under merchandise exports, 17 of the 30 key sectors exhibited positive growth during FY 2023-24 (April-March) as compared to FY 2022-23 (April-March). These include Iron Ore (117.74%), Electronic Goods (23.64%), Tobacco (19.46%), Ceramic Products & Glassware (14.44%), Fruits & Vegetables (13.86%), Meat, Dairy & Poultry Products (12.34%), Spices (12.3%), Coffee (12.22%), Drugs & Pharmaceuticals (9.67%), Cereal Preparations & Miscellaneous Processed Items (8.96%), Oil Seeds (7.43%), Oil Meals (7.01%), Handicrafts Excl. Hand Made Carpet (6.74%), Cotton Yarn/Fabs./Made-Ups, Handloom Products Etc. (6.71%), Carpet (2.13%), Engineering Goods (2.13%) and Tea (1.05%).
- Under merchandise imports, 16 of the 30 key sectors exhibited negative growth in FY 2023-24 (April-March) as compared to FY 2022-23 (April-March). These include Cotton Raw & Waste (-58.39%), Fertilisers, Crude & Manufactured (-39.23%), Sulphur & Unroasted Iron Pyrites (-37.51%), Vegetable Oil (-28.63%), Pearls, Precious & Semi-Precious Stones (-22.37%), Coal, Coke & Briquettes, Etc. (-21.81%), Organic & Inorganic Chemicals (-20.13%), Newsprint (-18.39%), Project Goods (-17.56%), Petroleum, Crude & Products (-14.23%), Transport Equipment (-14.02%), Textile Yarn Fabric, Made-Up Articles (-12.98%), Pulp And Waste Paper (-12.33%), Wood & Wood Products (-11.31%), Leather & Leather Products (-11.26%) and Artificial Resins, Plastic Materials, Etc. (-5.51%).
- Services exports is projected to grow positively at 4.39 percent during FY 2023-24 (April-March) over FY 2022-23 (April-March).
- India’s trade deficit has shown considerable improvement in FY 2023-24 (April-March). Overall trade deficit for FY 2023-24 (April-March)* is estimated at USD 78.12 Billion as compared to the deficit of USD 121.62 Billion during FY 2022-23 (April-March), registering a decline of (-) 35.77 percent. The merchandise trade deficit during FY 2023-24 (April-March) is USD 240.17 Billion compared to USD 264.90 Billion during FY 2022-23 (April-March), registering a decline of (-) 9.33 percent.