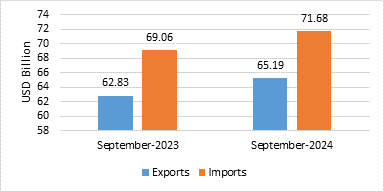
India’s total exports (Merchandise and Services combined) for September 2024* is estimated at USD 65.19 Billion, registering a positive growth of 3.76 percent vis-à-vis September 2023.Total imports (Merchandise and Services combined) for September 2024* is estimated at USD 71.68 Billion, registering a positive growth of 3.79 percent vis-à-vis September 2023.
Table 1: Trade during September 2024*
| September 2024
(USD Billion) |
September 2023
(USD Billion) |
||
| Merchandise | Exports | 34.58 | 34.41 |
| Imports | 55.36 | 54.49 | |
| Services* | Exports | 30.61 | 28.42 |
| Imports | 16.32 | 14.58 | |
| Total Trade
(Merchandise +Services) * |
Exports | 65.19 | 62.83 |
| Imports | 71.68 | 69.06 | |
| Trade Balance | -6.49 | -6.23 |
* Note: The latest data for services sector released by RBI is for August2024. The data for September 2024 is an estimation, which will be revised based on RBI’s subsequent release. (ii) Data for April-September 2023 and April-June 2024 has been revised on pro-rata basis using quarterly balance of payments data.
Fig 1: Total Trade during September2024*
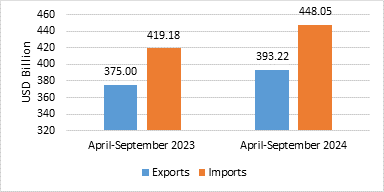
India’s total exports during April-September2024* is estimated at USD 393.22 Billion registering a positive growth of 4.86 percent. Total imports during April-September 2024* is estimated at USD 448.05 Billion registering a growth of 6.89 percent.
Table 2: Trade during April-September 2024*
| April-September 2024
(USD Billion) |
April-September 2023
(USD Billion) |
||
| Merchandise | Exports | 213.22 | 211.08 |
| Imports | 350.66 | 330.32 | |
| Services* | Exports | 180.00 | 163.92 |
| Imports | 97.39 | 88.86 | |
| Total Trade
(Merchandise +Services) * |
Exports | 393.22 | 375.00 |
| Imports | 448.05 | 419.18 | |
| Trade Balance | -54.83 | -44.18 |
Fig 2: Total Trade during April-September 2024*
MERCHANDISE TRADE
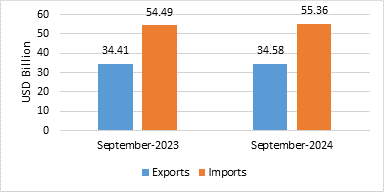
- Merchandise exports during September 2024 were USD 34.58 Billion as compared to USD 34.41 Billion in September 2023.
- Merchandise imports during September 2024 were USD 55.36 Billion as compared to USD 54.49 Billion in September 2023.
Fig 3: Merchandise Trade during September 2024
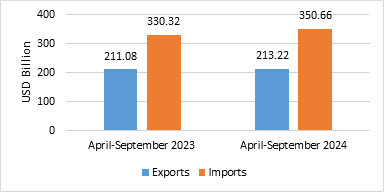
- Merchandise exports during April-September 2024 were USD 213.22 Billion as compared to USD 211.08Billion during April-September 2023.
- Merchandise imports during April-September 2024 were USD 350.66 Billion as compared to USD 330.32 Billion during April-September 2023.
- Merchandise trade deficit during April-September 2024 was USD 137.44 Billion as compared to USD 119.24 Billion during April-September 2023.
Fig4: Merchandise Trade during April-September 2024
- Non-petroleum and non-gems & jewellery exports in September 2024 were USD 27.03Billion compared to USD 24.76Billion in September 2023.
- Non-petroleum, non-gems & jewellery (gold, silver & precious metals) imports in September 2024 were USD 36.49Billion compared to USD 34.21Billion in September 2023.
Table 3: Trade excluding Petroleum and Gems & Jewellery during September 2024
September 2024(USD Billion) |
September 2023
(USD Billion) |
|
| Non- petroleum exports | 29.85 | 27.95 |
| Non- petroleum imports | 42.82 | 40.48 |
| Non-petroleum & Non-Gems & Jewellery exports | 27.03 | 24.76 |
| Non-petroleum & Non-Gems & Jewellery imports | 36.49 | 34.21 |
Note: Gems & Jewellery Imports include Gold, Silver & Pearls, precious & Semi-precious stones
Fig 5: Trade excluding Petroleum and Gems & Jewellery during September 2024

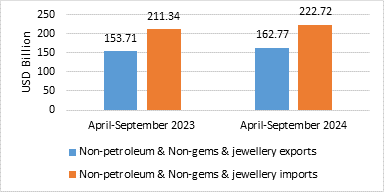
- Non-petroleum and non-gems & jewellery exports in April-September 2024 were USD 162.77 Billion, compared to USD 153.71 Billion in April-September 2023.
- Non-petroleum, non-gems & jewellery (gold, silver & precious metals) imports in April-September 2024 were USD 222.72 Billion, compared to USD 211.34 Billion in April-September 2023.
Table 4: Trade excluding Petroleum and Gems & Jewellery during April-September 2024
April-September 2024(USD Billion) |
April-September 2023
(USD Billion) |
|
| Non- petroleum exports | 176.68 | 169.33 |
| Non- petroleum imports | 261.75 | 246.36 |
| Non-petroleum &Non Gems& Jewellery exports | 162.77 | 153.71 |
| Non-petroleum & Non Gems & Jewellery imports | 222.72 | 211.34 |
Note: Gems & Jewellery Imports include Gold, Silver & Pearls, precious & Semi-precious stones
Fig 6: Trade excluding Petroleum and Gems & Jewellery during April-September 2024
SERVICES TRADE
- The estimated value of services export for September 2024* is USD 30.61 Billion as compared to USD 28.42Billion in September 2023.
- The estimated value of services imports for September 2024* is USD 16.32 Billion as compared to USD 14.58Billion in September 2023.
Fig 7: Services Trade during September2024*

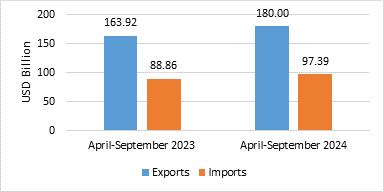
- The estimated value of service exports during April-September 2024* is USD 180 Billion as compared to USD 163.92 Billion in April-September 2023.
- The estimated value of service imports during April-September 2024* is USD 97.39 Billion as compared to USD 88.86 Billion in April-September 2023.
- The services trade surplus for April-September 2024* is USD 82.61 Billion as compared to USD 75.06 Billion in April-September 2023.
Fig 8: Services Trade during April-September 2024*
- Exports of Coffee (74.75%), Tobacco (50.9%), Handicrafts Excl. Hand Made Carpet (48.09%), Plastic & Linoleum (28.32%), Spices (26.66%), Rice (24.93%), Rmg Of All Textiles (17.3%), Jute Mfg. Including Floor Covering (16.45%), Cereal Preparations & Miscellaneous Processed Items (15.25%), Carpet (14.93%), Oil Seeds (14.73%), Oil Meals (13%), Man-Made Yarn/Fabs./Made-Ups Etc. (11.41%), Organic & Inorganic Chemicals (11.21%), Engineering Goods (10.55%), Leather & Leather Products (8.86%), Fruits & Vegetables (8.38%), Electronic Goods (7.89%), Meat, Dairy & Poultry Products (7.85%), Drugs & Pharmaceuticals (7.22%), Tea (5.73%), Cotton Yarn/Fabs./Made-Ups, Handloom Products Etc. (3.48%) and Cashew (2.23%) record positive growth during September 2024 over the corresponding month of last year.
- Imports of Dyeing/Tanning/Colouring Mtrls. (-25.92%), Vegetable Oil (-23.24%), Pearls, Precious & Semi-Precious Stones (-21.62%), Leather & Leather Products (-16.62%), Newsprint (-13.62%), Petroleum, Crude & Products (-10.44%), Artificial Resins, Plastic Materials, Etc. (-8.76%), Coal, Coke & Briquettes, Etc. (-2.14%), Textile Yarn Fabric, Made-Up Articles (-1.8%) and Transport Equipment (-0.38%) record negative growth during September 2024 over the corresponding month of last year.
- Services exports is estimated to grow by 9.81percent during April-September 2024* over April-September 2023.
- Top 5 export destinations, in terms of change in value, exhibiting positive growth in September 2024 vis a vis September 2023 are Netherland (38.6%), U Arab Emts (23.75%), U S A (4.98%), Brazil (41.98%) and Japan (36.35%).
- Top 5 export destinations, in terms of change in value, exhibiting positive growth in April-September 2024 vis a vis April-September 2023 are Netherland (36.73%), U S A (5.6%), U Arab Emts (11.45%), Malaysia (27.91%) and U K (12.4%).
- Top 5 import sources, in terms of change in value, exhibiting growth in September 2024 vis a vis September 2023 are U Arab Emts (49.22%), China P Rp (14.46%), Germany (32.52%), Japan (25.72%) and Taiwan (38.17%)
- Top 5 import sources, in terms of change in value, exhibiting growth in April-September 2024 vis a vis April-September2023 are U Arab Emts (52.01%), China P Rp (11.52%), Russia (5.73%), Taiwan (39.97%) and Oman (51.52%).