Home » Commerce and Industry » Final growth rate of Index of Eight Core Industries for September 2022 is revised to 8.3 per cent from its provisional level 7.9 per cent

Final growth rate of Index of Eight Core Industries for September 2022 is revised to 8.3 per cent from its provisional level 7.9 per cent

The combined Index of Eight Core Industries (ICI) increased by 7.4 per cent (provisional) in December 2022 as compared to the Index of December 2021. The production of Coal, Electricity, Steel, Cement, Fertilizers, Refinery Products and Natural Gas increased in December 2022 over the corresponding month of last year. ICI measures combined and individual performance of production of eight core industries viz. Coal, Crude Oil, Natural Gas, Refinery Products, Fertilizers, Steel, Cement and Electricity. The Eight Core Industries comprise 40.27 percent of the weight of items included in the Index of Industrial Production (IIP). Details of annual and monthly indices and growth rates are provided at Annex I & II respectively.

2.         Final growth rate of Index of Eight Core Industries for September 2022 is revised to 8.3 per cent from its provisional level 7.9 per cent. The cumulative growth rate of ICI during April-December 2022 was 8.0 per cent (provisional) as compared to the corresponding period of last year.

3.      The summary of the Index of Eight Core Industries is given below:

Coal – Coal production (weight: 10.33 per cent) increased by 11.5 per cent in December, 2022 over December, 2021. Its cumulative index increased by 16.4 per cent during April to December 2022 over corresponding period of the previous year.

Crude Oil – Crude Oil production (weight: 8.98 per cent) declined by 1.2 per cent in December, 2022 over December, 2021. Its cumulative index declined by 1.3 per cent during April to December, 2022 over the corresponding period of previous year.

Natural Gas – Natural Gas production (weight: 6.88 per cent) increased by 2.6 per cent in December, 2022 over December, 2021. Its cumulative index increased by 0.9 per cent during April to December, 2022 over the corresponding period of previous year.

Petroleum Refinery Products – Petroleum Refinery production (weight: 28.04 per cent) increased by 3.7 per cent in December, 2022 over December, 2021. Its cumulative index increased by 5.5 per cent during April to December, 2022 over the corresponding period of previous year.

Fertilizers – Fertilizers production (weight: 2.63 per cent) increased by 7.3 per cent in December, 2022 over December, 2021. Its cumulative index increased by 9.6 per cent during April to December, 2022 over the corresponding period of previous year.

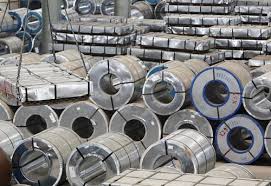
Steel – Steel production (weight: 17.92 per cent) increased by 9.2 per cent in December, 2022 over December, 2021. Its cumulative index increased by 7.7 per cent during April to December, 2022 over the corresponding period of previous year.

Cement – Cement production (weight: 5.37 per cent) increased by 9.1 per cent in December, 2022 over December, 2021. Its cumulative index increased by 10.6 per cent during April to December, 2022 over the corresponding period of previous year.

Electricity – Electricity generation (weight: 19.85 per cent) increased by 10.0 per cent in December, 2022 over December, 2021. Its cumulative index increased by 9.8 per cent during April to December, 2022 over the corresponding period of previous year.

Note 1: Data for October, 2022, November, 2022 and December, 2022 are provisional. Index numbers of Core Industries are revised /finalized as per updated data from source agencies.

Note 2: Since April, 2014, Electricity generation data from Renewable sources are also included.

Note 3: The industry-wise weights indicated above are individual industry weight derived from IIP and blown up on pro rata basis to a combined weight of ICI equal to 100.

Note 4: Since March 2019, a new steel product called Hot Rolled Pickled and Oiled (HRPO) under the item ‘Cold Rolled (CR) coils’ within the production of finished steel has also been included.

Note 5: Release of the index for January, 2023 will be on Tuesday 28th February, 2023.


Annex I

Performance of Eight Core Industries

Yearly Index & Growth Rate

Base Year: 2011-12=100

Index

Sector Coal Crude Oil Natural Gas Refinery Products Fertilizers Steel Cement Electricity Overall Index
Weight 10.33 8.98 6.88 28.04 2.63 17.92 5.37 19.85 100.00
2012-13 103.2 99.4 85.6 107.2 96.7 107.9 107.5 104.0 103.8
2013-14 104.2 99.2 74.5 108.6 98.1 115.8 111.5 110.3 106.5
2014-15 112.6 98.4 70.5 108.8 99.4 121.7 118.1 126.6 111.7
2015-16 118.0 97.0 67.2 114.1 106.4 120.2 123.5 133.8 115.1
2016-17 121.8 94.5 66.5 119.7 106.6 133.1 122.0 141.6 120.5
2017-18 124.9 93.7 68.4 125.2 106.6 140.5 129.7 149.2 125.7
2018-19 134.1 89.8 69.0 129.1 107.0 147.7 147.0 156.9 131.2
2019-20 133.6 84.5 65.1 129.4 109.8 152.6 145.7 158.4 131.6
2020-21 131.1 80.1 59.8 114.9 111.6 139.4 130.0 157.6 123.2
2021-22 142.3 77.9 71.3 125.1 112.4 163.0 156.9 170.1 136.1
Apr-Dec  2021* 127.6 78.3 71.8 122.1 113.8 159.4 148.9 169.3 132.5
Apr-Dec  2022* 148.4 77.3 72.5 128.7 124.7 171.6 164.8 186.0 143.1

*Provisional


Growth Rates (on Y-o-Y basis in per cent)

Sector Coal Crude Oil Natural Gas Refinery Products Fertilizers Steel Cement Electricity Overall Growth
Weight 10.33 8.98 6.88 28.04 2.63 17.92 5.37 19.85 100.00
2012-13 3.2 -0.6 -14.4 7.2 -3.3 7.9 7.5 4.0 3.8
2013-14 1.0 -0.2 -12.9 1.4 1.5 7.3 3.7 6.1 2.6
2014-15 8.0 -0.9 -5.3 0.2 1.3 5.1 5.9 14.8 4.9
2015-16 4.8 -1.4 -4.7 4.9 7.0 -1.3 4.6 5.7 3.0
2016-17 3.2 -2.5 -1.0 4.9 0.2 10.7 -1.2 5.8 4.8
2017-18 2.6 -0.9 2.9 4.6 0.0 5.6 6.3 5.3 4.3
2018-19 7.4 -4.1 0.8 3.1 0.3 5.1 13.3 5.2 4.4
2019-20 -0.4 -5.9 -5.6 0.2 2.7 3.4 -0.9 0.9 0.4
2020-21 -1.9 -5.2 -8.2 -11.2 1.7 -8.7 -10.8 -0.5 -6.4
2021-22 8.5 -2.6 19.2 8.9 0.7 16.9 20.8 8.0 10.4
Apr-Dec  2021* 10.6 -2.6 22.4 10.0 -0.1 22.2 26.3 9.4 12.6
Apr-Dec  2022* 16.4 -1.3 0.9 5.5 9.6 7.7 10.6 9.8 8.0

*Provisional,YoY is calculated over the corresponding financial year of previous year


Annex II

Performance of Eight Core Industries

Monthly Index & Growth Rate

Base Year: 2011-12=100

Index

Sector Coal Crude Oil Natural Gas Refinery Products Fertilizers Steel Cement Electricity Overall Index
Weight 10.33 8.98 6.88 28.04 2.63 17.92 5.37 19.85 100.00
Dec-21 164.3 79.1 72.7 134.4 121.1 169.9 168.8 162.5 141.7
Jan-22 174.8 79.1 71.4 135.8 115.2 174.5 176.4 165.6 144.8
Feb-22 174.4 71.6 64.9 124.9 102.4 165.0 167.7 160.8 137.1
Mar-22 210.8 79.6 72.6 142.5 107.7 182.4 198.8 191.0 158.0
Apr-22 147.7 77.8 70.9 134.7 96.1 164.0 170.9 194.5 144.6
May-22 156.3 80.3 73.5 137.3 126.0 172.0 165.4 199.9 149.6
Jun-22 148.0 76.9 70.9 130.3 126.4 158.2 177.4 196.9 143.9
Jul-22 132.7 77.3 72.6 129.8 127.6 166.8 155.4 188.9 141.1
Aug-22 127.5 76.7 73.0 123.6 130.9 170.5 152.0 191.3 139.9
Sep-22 127.5 75.2 72.1 120.2 127.0 172.8 158.7 187.4 138.6
Oct-22* 145.6 77.4 73.0 123.5 129.5 178.6 154.9 169.3 139.0
Nov-22* 167.4 75.8 71.8 119.7 129.2 175.7 164.1 166.7 139.4
Dec-22* 183.1 78.2 74.5 139.3 129.9 185.5 184.1 178.7 152.2

*Provisional


Growth Rates (on Y-o-Y basis in per cent)

Sector Coal Crude Oil Natural Gas Refinery Products Fertilizers Steel Cement Electricity Overall Growth
Weight 10.33 8.98 6.88 28.04 2.63 17.92 5.37 19.85 100.00
Dec-21 5.2 -1.8 19.5 5.9 3.5 -0.6 14.2 2.9 4.1
Jan-22 8.2 -2.4 11.7 3.7 -2.0 3.8 14.1 0.9 4.0
Feb-22 6.6 -2.2 12.5 8.8 -1.4 5.6 4.2 4.5 5.9
Mar-22 0.3 -3.4 7.6 6.1 15.3 4.1 9.0 6.1 4.8
Apr-22 30.1 -0.9 6.4 9.2 8.8 2.5 7.4 11.8 9.5
May-22 33.5 4.6 7.0 16.7 22.9 15.1 26.2 23.5 19.3
Jun-22 32.1 -1.7 1.2 15.1 8.2 3.3 19.7 16.5 13.1
Jul-22 11.4 -3.8 -0.3 6.2 6.2 7.5 0.7 2.3 4.8
Aug-22 7.7 -3.3 -0.9 7.0 11.9 5.8 2.1 1.4 4.2
Sep-22 12.1 -2.3 -1.7 6.6 11.8 7.7 12.4 11.6 8.3
Oct-22* 3.7 -2.2 -4.2 -3.1 5.4 6.5 -4.3 1.2 0.9
Nov-22* 12.2 -1.1 -0.7 -9.3 6.4 11.7 29.0 12.7 5.7
Dec-22* 11.5 -1.2 2.6 3.7 7.3 9.2 9.1 10.0 7.4

*Provisional,YoY is calculated over the corresponding month of previous year

About IIPnews

Leave a Reply

Your email address will not be published. Required fields are marked *

*

x

Check Also

Combined Index of Eight Core Industries increases by 6.7% (provisional) in Feb 2024 as compared to Index of Feb 2023

The combined Index of Eight Core Industries (ICI) increased by 6.7per cent (provisional) in February 2024 ...

Highest monthly merchandise exports, in the current FY so far, recorded in February 2024. India’s merchandise exports in February 2024 stands at USD 41.40 Billion; an increase of 11.86% over USD 37.01 Billion in February 2023

India’s overall exports (Merchandise and Services combined) in February 2024* is estimated to be USD ...

Index Numbers of Wholesale Price in India for the Month of February, 2024 (Base Year: 2011-12)

The annual rate of inflation based on all India Wholesale Price Index (WPI) number is ...

Government of India notifies extension of Remission of Duties and Taxes on Exported Products support to Advance Authorisation Holders, Export Oriented Units and Special Economic Zones Units

Union Minister of Commerce & Industry, Consumer Affairs, Food and Public Distribution, and Textiles, Shri ...

Financial assistance under ‘Tea Development & Promotion Scheme’ increases by 82% from Rs. 290.81 crores to Rs.528.97 crore for 2024-25 and 2025-26

The financial assistance for the Tea sector under the ‘Tea Development & Promotion Scheme’ has ...

Cabinet approves Uttar Poorva Transformative Industrialization Scheme, 2024

The Union Cabinet chaired by Prime Minister Shri Narendra Modi approved the proposal of the Ministry of ...

DPIIT notifies Quality Control Orders for ‘Potable water bottles’ and ‘Flame-Producing Lighter’

Department for Promotion of Industry and Internal Trade (DPIIT), Ministry of Commerce & Industry has ...

‘Intense momentum marks the opening day of Startup20’s third meeting in Goa Over 250 International, National delegates participate on Day One

The Startup20 Engagement Group of the G20 kicked off its third meeting, the Goa Sankalpana, ...

Spices Board establishes eight crop specific Spices Parks across the country

Spices Board has established eight crop specific Spices Parks across the country, the Minister of ...

Seafood products export from India during the last three years has increases from US$ 6679 million in FY 2019-20 to an all-time high record figure of US$ 7759.58 million in FY 2021-22

Seafood products export from India during the last three years has increased from US$ 6679 ...

WP2Social Auto Publish Powered By : XYZScripts.com