The Labour Bureau, an attached office of the M/o Labour & Employment, has been compiling Consumer Price Index for Industrial Workers every month on the basis of retail prices collected from 317 markets spread over 88 industrially important centres in the country. The index is compiled for 88 centres and All-India and is released on the last working day of succeeding month. The index for the month of October, 2021 is being released in this press release.
The All-India CPI-IW for October, 2021 increased by 1.6 points and stood at 124.9 (one hundred twenty four and point nine). On 1-month percentage change, it increased by 1.30 per cent with respect to previous month compared to an increase of 1.19 per cent recorded between corresponding months a year ago.
The maximum upward pressure in current index came from Food & Beverages group contributing 1.31 percentage points to the total change. At item level, Mustard Oil, Tomato, Onion, Brinjal, Cabbage, Cauliflower, Lady’s Finger, Peas, Potato, Cooking Gas, Petrol for Vehicle, etc. are responsible for the rise in index. However, this increase was largely checked by Moong Dal, Fish Fresh, Apple, Grapes, Orange, Ginger, etc. putting downward pressure on the index.
Shri D.P.S.Negi, Principal Labour & Employment Advisor & Chief Labour Commissioner(C) informed that at centre level, Udham Singh Nagar recorded a maximum increase of 5.8 points followed by Ramgarh and Biswanath-Chariali with 4.6 points and 4.0 points respectively. Among others, 5 centres observed an increase between 3 to 3.9 points, 22 centres between 2 to 2.9 points, 39 centres between 1 to 1.9 points and 16 centres between 0.1 to 0.9 points. On the contrary, Ludhiana recorded a maximum decrease of 0.3 points followed by Idukki and Darjeeling with 0.2 points each.
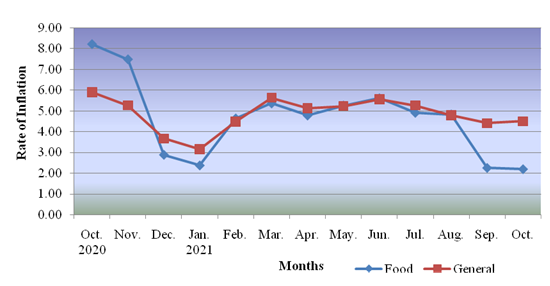
Year-on-year inflation for the month stood at 4.50 per cent compared to 4.41 per cent for the previous month and 5.91 per cent during the corresponding month a year before. Similarly, Food inflation stood at 2.20 per cent against 2.26 per cent of the previous month and 8.21 per cent during the corresponding month a year ago.
Y-o-Y Inflation based on CPI-IW (Food and General)
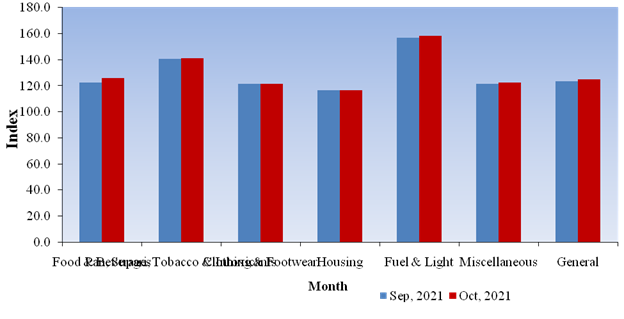
All-India Group-wise CPI-IW for September and October, 2021
| Sr. No. | Groups | September, 2021 | October, 2021 |
| I | Food & Beverages | 122.4 | 125.7 |
| II | Pan, Supari, Tobacco & Intoxicants | 140.8 | 141.1 |
| III | Clothing & Footwear | 121.5 | 121.5 |
| IV | Housing | 116.8 | 116.8 |
| V | Fuel & Light | 156.9 | 158.3 |
| VI | Miscellaneous | 121.7 | 122.3 |
| General Index | 123.3 | 124.9 |
CPI-IW: Groups Indices
The next issue of CPI-IW for the month of November, 2021 will be released on Friday, 31st December, 2021.