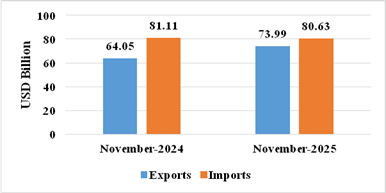
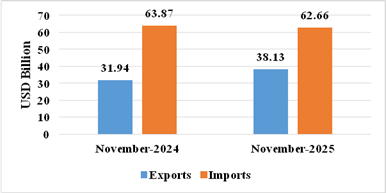
India’s total exports (Merchandise and Services combined) for November 2025* is estimated at US$ 73.99 Billion, registering a positive growth of 15.52 percent vis-à-vis November 2024. Total imports (Merchandise and Services combined) for November 2025* is estimated at US$ 80.63 Billion, registering a negative growth of (-) 0.60 percent vis-à-vis November 2024
Table 1: Trade during November 2025*
| November 2025
(US$ Billion) |
November 2024
(US$ Billion) |
||
| Merchandise | Exports | 38.13 | 31.94 |
| Imports | 62.66 | 63.87 | |
| Services* | Exports | 35.86 | 32.11 |
| Imports | 17.96 | 17.25 | |
| Total Trade
(Merchandise +Services) * |
Exports | 73.99 | 64.05 |
| Imports | 80.63 | 81.11 | |
| Trade Balance | -6.64 | -17.06 |
* Note: The latest data for services sector released by RBI is for October 2025. The data for November 2025 is an estimation. (ii) Data for April-November 2024 and April-June 2025 has been revised on pro-rata basis using quarterly balance of payments data.
Fig 1: Total Trade during November 2025*
India’s total exports during April-November 2025* is estimated at US$ 562.13 Billion registering a positive growth of 5.43 percent. Total imports during April-November 2025* is estimated at US$ 651.13 Billion registering a growth of 5 percent.
Table 2: Trade during April-November 2025*
| April-November 2025
(US$ Billion) |
April-November 2024
(US$ Billion) |
||
| Merchandise | Exports | 292.07 | 284.60 |
| Imports | 515.21 | 487.93 | |
| Services* | Exports | 270.06 | 248.56 |
| Imports | 135.93 | 132.21 | |
| Total Trade
(Merchandise +Services) * |
Exports | 562.13 | 533.16 |
| Imports | 651.13 | 620.14 | |
| Trade Balance | -89.00 | -86.98 |
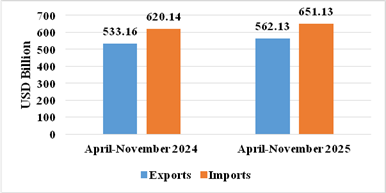
Fig 2: Total Trade during April-November 2025*
MERCHANDISE TRADE
- Merchandise exports during November 2025 were US$ 38.13 Billion as compared to US$ 31.94 Billion in November 2024.
- Merchandise imports during November 2025 were US$ 62.66 Billion as compared to US$ 63.87 Billion in November 2024.
Fig 3: Merchandise Trade during November 2025
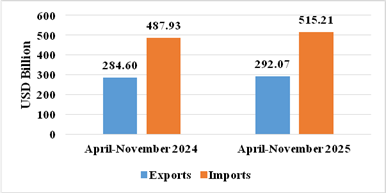
- Merchandise exports during April-November 2025 were US$ 292.07 Billion as compared to US$ 284.60 Billion during April-November 2024.
- Merchandise imports during April-November 2025 were US$ 515.21 Billion as compared to US$ 487.93 Billion during April-November 2024.
- Merchandise trade deficit during April-November 2025 was US$ 223.13 Billion as compared to US$ 203.33 Billion during April-November 2024.
Fig 4: Merchandise Trade during April-November 2025
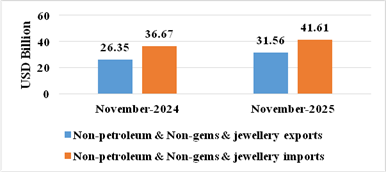
- Non-petroleum and non-gems & jewellery exports in November 2025 were US$ 31.56 Billion compared to US$ 26.35 Billion in November 2024.
- Non-petroleum, non-gems & jewellery (gold, silver & precious metals) imports in November 2025 were US$ 41.61 Billion compared to US$ 36.67 Billion in November 2024.
Table 3: Trade excluding Petroleum and Gems & Jewellery during November 2025
November 2025(US$ Billion) |
November 2024
(US$ Billion) |
|
| Non- petroleum exports | 34.20 | 28.42 |
| Non- petroleum imports | 48.55 | 47.96 |
| Non-petroleum & Non-Gems & Jewellery exports | 31.56 | 26.35 |
| Non-petroleum & Non-Gems & Jewellery imports | 41.61 | 36.67 |
Note: Gems & Jewellery Imports include Gold, Silver & Pearls, precious & Semi-precious stones
Fig 5: Trade excluding Petroleum and Gems & Jewellery during November 2025
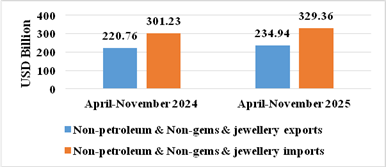
- Non-petroleum and non-gems & jewellery exports in April-November 2025 were US$ 234.94 Billion, compared to US$ 220.76 Billion in April-November 2024.
- Non-petroleum, non-gems & jewellery (gold, silver & precious metals) imports in April-November 2025 were US$ 329.36 Billion, compared to US$ 301.23 Billion in April-November 2024.
Table 4: Trade excluding Petroleum and Gems & Jewellery during April-November 2025
April-November 2025(US$ Billion) |
April-November 2024
(US$ Billion) |
|
| Non- petroleum exports | 254.08 | 240.02 |
| Non- petroleum imports | 394.18 | 360.09 |
| Non-petroleum & Non Gems & Jewellery exports | 234.94 | 220.76 |
| Non-petroleum & Non Gems & Jewellery imports | 329.36 | 301.23 |
Note: Gems & Jewellery Imports include Gold, Silver & Pearls, precious & Semi-precious stones
Fig 6: Trade excluding Petroleum and Gems & Jewellery during April-November 2025
SERVICES TRADE
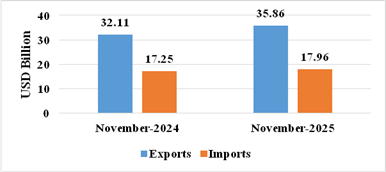
- The estimated value of services export for November 2025* is US$ 35.86 Billion as compared to US$ 32.11 Billion in November 2024.
- The estimated value of services imports for November 2025* is US$ 17.96 Billion as compared to US$ 17.25 Billion in November 2024.
Fig 7: Services Trade during November 2025*
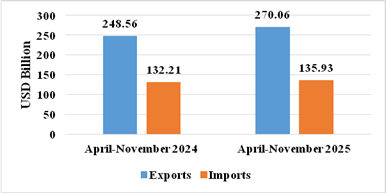
- The estimated value of service exports during April-November 2025* is US$ 270.06 Billion as compared to US$ 248.56 Billion in April-November 2024.
- The estimated value of service imports during April-November 2025* is US$ 135.93 Billion as compared to US$ 132.21 Billion in April-November 2024.
- The services trade surplus for April-November 2025* is US$ 134.13 Billion as compared to US$ 116.35 Billion in April-November 2024.
Fig 8: Services Trade during April-November 2025*
- Exports of Iron Ore (70.23%), Cashew (57.17%), Oil Meals (40.28%), Other Cereals (40.17%), Mica, Coal & Other Ores, Minerals Including Processed Minerals (39.71%), Electronic Goods (38.96%), Coffee (34.31%), Meat, Dairy & Poultry Products (31.37%), Handicrafts Excl. Hand Made Carpet (29.74%), Gems & Jewellery (27.8%), Engineering Goods (23.76%), Drugs & Pharmaceuticals (20.91%), Ceramic Products & Glassware (20.07%), Organic & Inorganic Chemicals (18.49%), Cereal Preparations & Miscellaneous Processed Items (17.69%), Tea (17.42%), Man-Made Yarn/Fabs./Made-Ups Etc. (15.72%), Marine Products (15.54%), Spices (12.96%), Petroleum Products (11.65%), Rmg Of All Textiles (11.27%), Leather & Leather Products (5.88%), Tobacco (5.57%), Cotton Yarn/Fabs./Made-Ups, Handloom Products Etc. (4.09%) and Fruits & Vegetables (3.09%) record positive growth during November 2025 over the corresponding month of last year.
- Imports of Gold (-59.15%), Newsprint (-23.37%), Vegetable Oil (-19.77%), Petroleum, Crude & Products (-11.27%), Coal, Coke & Briquettes, Etc. (-5.71%), Chemical Material & Products (-4.05%), Artificial Resins, Plastic Materials, Etc. (-2.42%), Pulp And Waste Paper (-1.31%) and Organic & Inorganic Chemicals (-0.1%) record negative growth during November 2025 over the corresponding month of last year.
- Services exports is estimated to grow by 8.65 percent during April-November 2025* over April-November 2024.
- Top 5 export destinations, in terms of change in value, exhibiting positive growth in November 2025 vis a vis November 2024 are U S A (22.61%), China P Rp (90.12%), Spain (181.33%), U Arab Emts (13.16%) and Tanzania Rep (126.36%).
- Top 5 export destinations, in terms of change in value, exhibiting positive growth in April-November 2025 vis a vis April-November 2024 are U S A (11.38%), China P Rp (32.83%), Spain (54.54%), U Arab Emts (6.7%) and Hong Kong (22.37%).
- Top 5 import sources, in terms of change in value, exhibiting growth in November 2025 vis a vis November 2024 are China P Rp (18.28%), U S A (38.29%), Thailand (80.96%), Hong Kong (41.44%) and Brazil (77.42%).
- Top 5 import sources, in terms of change in value, exhibiting growth in April-November 2025 vis a vis April-November 2024 are China P Rp (12.63%), U S A (13.49%), Hong Kong (32.43%), U Arab Emts (8.81%) and Ireland (137%).