Home » Chemicals & Petrochemicals » Index of Eight Core Industries (Base: 2011-12=100) for October, 2021

Index of Eight Core Industries (Base: 2011-12=100) for October, 2021

The Office of Economic Adviser, Department for Promotion of Industry and Internal Trade (DPIIT) is releasing Index of Eight Core Industries (ICI) for the Month of October, 2021.ICI measures combined and individual performance of production in selected eight core industries viz. Coal, Crude Oil, Natural Gas, Refinery Products, Fertilizers, Steel, Cement and Electricity.The Eight Core Industries comprise 40.27 percent of the weight of items included in the Index of Industrial Production (IIP). Details of yearly and monthly indices and growth rates are provided at Annex I & II respectively.

The combined Index of Eight Core Industries stood at 136.2 in October 2021, which increased by7.5 per cent (provisional) as compared to the Index ofOctober 2020. The production of Coal, Natural Gas, Refinery Products, Fertilizers,Steel, Cement and Electricity industries increased in October 2021 over the corresponding periodof last year.

Final growth rate of Index of Eight Core Industries for July 2021 is revised to 9.9%from its provisional level 9.4%. The growth rate of ICI during April-October2021-22 was 15.1% (P) as compared to the corresponding period of lastFY.

The summary of the Index of Eight Core Industries is given below:

Coal –Coal production (weight: 10.33 per cent) increased by 14.6 per centin October,2021 overOctober,2020. Its cumulative index increased by 12.2 per centduring April to October,2021-22 over corresponding period of the previous year.

Crude Oil–Crude Oil production (weight: 8.98 per cent) declined by 2.2 per centinOctober, 2021 over October,2020. Its cumulative index declined by 2.8 per centduring April to October, 2021-22over the corresponding period of previous year.

Natural Gas – Natural Gas production (weight: 6.88 per cent) increased by 25.8 per cent inOctober, 2021over October, 2020. Its cumulative index increased by 22.6 per cent during April to October, 2021-22 over the corresponding period of previous year.

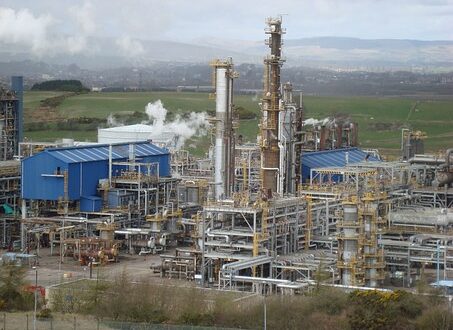
Petroleum Refinery Products–Petroleum Refinery production (weight: 28.04 per cent) increased by 14.4 per centin October, 2021 over October, 2020. Its cumulative index increased by 11.7 per cent during April to  October, 2021-22over the corresponding period of previous year.

Fertilizers – Fertilizers production (weight: 2.63 per cent) increased by0.04 per centinOctober, 2021 over October, 2020. Its cumulative index decreased by 1.1 per centduring April toOctober, 2021-22 over the corresponding period of previous year.

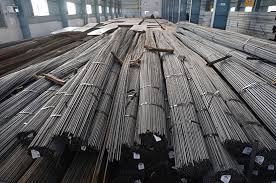
Steel –Steel production (weight: 17.92 per cent)increased by 0.9 per cent in October, 2021 over October, 2020. Its cumulative index increased by 28.6 per centduring April to October, 2021-22 over the corresponding period of previous year.

Cement –Cement production (weight: 5.37 per cent) increased by 14.5 per centin October, 2021 over October, 2020. Its cumulative index increased by 33.6 per centduring April to October, 2021-22 over the corresponding period of previous year.

Electricity –Electricity generation (weight: 19.85 per cent) increased by 2.8per centin October, 2021 over October,2020. Its cumulative index increased by 11.3 per centduring April to October, 2021-22 over the corresponding period of previous year.

Note 1: Data for August, 2021, September, 2021 and October, 2021 are provisional.

Note 2: Since April, 2014, Electricity generation data from Renewable sources are also included.

Note 3: The industry-wise weights indicated above are individual industry weight derived from IIP and blown up on pro rata basis to a combined weight of ICI equal to 100.

Note 4: Since March 2019, a new steel product called Hot Rolled Pickled and Oiled (HRPO) under the item ‘Cold Rolled (CR) coils’ within the production of finished steel has also been included.

Note 5: Release of the index for November,2021 will be on Friday31st December, 2021.

Annex I

Performance of Eight Core Industries

Yearly Index & Growth Rate

Base Year: 2011-12=100

                                                                                                       Index

Sector Weight 2012-13 2013-14 2014-15 2015-16 2016-17 2017-18 2018-19 2019-20 2020-21 Apr- Oct 2020-21 Apr- Oct  2021-22*
Coal 10.3335 103.2 104.2 112.6 118.0 121.8 124.9 134.1 133.6 131.1 106.3 119.2
Crude Oil 8.9833 99.4 99.2 98.4 97.0 94.5 93.7 89.8 84.5 80.1 80.7 78.5
Natural Gas 6.8768 85.6 74.5 70.5 67.2 66.5 68.4 69.0 65.1 59.8 58.4 71.6
Refinery Products 28.0376 107.2 108.6 108.8 114.1 119.7 125.2 129.1 129.4 114.9 106.4 118.9
Fertilizers 2.6276 96.7 98.1 99.4 106.4 106.6 106.6 107.0 109.8 111.6 112.8 111.6
Steel 17.9166 107.9 115.8 121.7 120.2 133.1 140.5 147.7 152.6 139.4 120.9 155.5
Cement 5.3720 107.5 111.5 118.1 123.5 122.0 129.7 147.0 145.7 130.0 111.7 149.2
Electricity 19.8530 104.0 110.3 126.6 133.8 141.6 149.2 156.9 158.4 157.6 155.7 173.3
Overall Index 100.00 103.8 106.5 111.7 115.1 120.5 125.7 131.2 131.6 123.2 113.6 130.8

*Provisional

Growth Rates (on Y-o-Y basis in per cent)


Sector Weight 2012-13 2013-14 2014-15 2015-16 2016-17 2017-18 2018-19 2019-20 2020-21 Apr-Oct  2020-21 Apr- Oct  2021-22*
Coal 10.3335 3.2 1.0 8.0 4.8 3.2 2.6 7.4 -0.4 -1.9 -3.6 12.2
Crude Oil 8.9833 -0.6 -0.2 -0.9 -1.4 -2.5 -0.9 -4.1 -5.9 -5.2 -6.1 -2.8
Natural Gas 6.8768 -14.4 -12.9 -5.3 -4.7 -1.0 2.9 0.8 -5.6 -8.2 -12.5 22.6
Refinery Products 28.0376 7.2 1.4 0.2 4.9 4.9 4.6 3.1 0.2 -11.2 -16.4 11.7
Fertilizers 2.6276 -3.3 1.5 1.3 7.0 0.2 0.03 0.3 2.7 1.7 4.1 -1.1
Steel 17.9166 7.9 7.3 5.1 -1.3 10.7 5.6 5.1 3.4 -8.7 -20.9 28.6
Cement 5.3720 7.5 3.7 5.9 4.6 -1.2 6.3 13.3 -0.9 -10.8 -21.2 33.6
Electricity 19.8530 4.0 6.1 14.8 5.7 5.8 5.3 5.2 0.9 -0.5 -5.5 11.3
Overall Growth 100.00 3.8 2.6 4.9 3.0 4.8 4.3 4.4 0.4 -6.4 -12.6 15.1

*Provisional,YoY is calculated over the corresponding financial year of previous year

Annex II

Performance of Eight Core Industries

Monthly Index & Growth Rate

Base Year: 2011-12=100

Index

Sector Coal Crude Oil Natural Gas Refinery Products Fertilizers Steel Cement Electricity Overall Index
Weight 10.3335 8.9833 6.8768 28.0376 2.6276 17.9166 5.3720 19.8530 100.00
Oct-20 122.4 80.9 60.6 111.5 122.8 158.4 141.3 162.2 126.7
Nov-20 137.9 78.3 58.4 126.5 118.5 156.0 132.1 144.8 127.7
Dec-20 156.2 80.5 60.8 126.9 117.0 170.9 147.8 157.9 136.1
Jan-21 161.6 81.1 64.0 130.9 117.5 168.1 154.6 164.2 139.2
Feb-21 163.6 73.2 57.7 114.8 103.9 156.3 160.9 153.9 129.6
Mar-21 210.3 82.4 67.5 134.4 93.4 175.2 182.5 180.0 150.8
Apr-21 113.5 78.5 66.7 123.4 88.3 160.0 159.0 174.0 132.0
May-21 117.1 76.8 68.7 117.7 102.5 149.4 131.1 161.9 125.4
Jun-21 112.1 78.2 70.0 113.2 116.9 153.1 148.2 169.1 127.2
Jul-21 119.2 80.3 72.8 122.2 120.1 155.2 154.3 184.7 134.7
Aug-21* 118.4 79.4 73.7 115.5 117.0 156.6 148.8 188.7 133.4
Sep-21* 114.0 77.0 73.3 112.7 113.6 154.1 141.1 167.9 126.9
Oct-21* 140.4 79.2 76.3 127.5 122.9 159.8 161.9 166.6 136.2

*Provisional

Growth Rates (on Y-o-Y basis in per cent)

Sector Coal Crude Oil Natural Gas Refinery Products Fertilizers Steel Cement Electricity Overall Growth
Weight 10.3335 8.9833 6.8768 28.0376 2.6276 17.9166 5.3720 19.8530 100.00
Oct-20 11.7 -6.2 -8.6 -17.0 6.3 5.9 3.2 11.2 -0.5
Nov-20 3.3 -4.9 -9.3 -4.8 1.6 0.7 -7.3 3.5 -1.1
Dec-20 2.2 -3.6 -7.2 -2.8 -2.9 3.5 -7.2 5.1 0.4
Jan-21 -1.9 -4.6 -2.1 -2.6 0.8 8.2 -5.8 5.5 1.3
Feb-21 -4.4 -3.2 -1.0 -10.9 -3.7 2.2 0.2 0.2 -3.3
Mar-21 0.3 -3.1 12.3 -0.7 -5.0 31.5 40.6 22.5 12.6
Apr-21 9.5 -2.1 25.0 30.9 3.9 494.8 606.6 38.5 62.6
May-21 7.0 -6.3 20.1 15.3 -9.6 55.1 11.7 7.5 16.4
Jun-21 7.4 -1.8 20.6 2.4 2.0 25.2 7.5 8.2 9.4
Jul-21 18.8 -3.2 19.0 6.7 0.6 9.4 21.7 11.0 9.9
Aug-21* 20.6 -2.3 20.7 9.1 -3.1 3.9 36.3 16.0 11.5
Sep-21* 8.0 -1.7 27.5 6.0 0.04 2.8 11.3 0.9 4.5
Oct-21* 14.6 -2.2 25.8 14.4 0.04 0.9 14.5 2.8 7.5

*Provisional,YoY is calculated over the corresponding month of previous year


About IIPnews

Leave a Reply

Your email address will not be published. Required fields are marked *

*

x

Check Also

Highlights of Telecom Subscription Data as on 31st August, 2024

Particulars Wireless Wireline Total (Wireless+ Wireline) Broadband Subscribers (Million) 906.37 42.84 949.21 Urban Telephone Subscribers (Million) 633.21 ...

Ministry of Coal to Host Star Rating Awards Ceremony, Stakeholder Consultation on MDOs, and Release of Coal Directory on October 21, 2024

Ministry of Coal is organizing the Star Rating Awards Ceremony, Stakeholder Consultation on Mining Developers ...

The cumulative value of merchandise exports during April-September 2024 was USD 213.22 Billion, as compared to USD 211.08 Billion during April-September 2023, registering a positive growth of 1.02%.

India’s total exports (Merchandise and Services combined) for September 2024* is estimated at USD 65.19 ...

Court awards Rs. 10 lakhs as damages to Jan Aushadhi in trademark battle

In a landmark victory in a court battle, the New Delhi District court has issued ...

Government Accelerates Development of Coal Evacuation Infrastructure to Achieve Viksit Bharat 2047

In its relentless pursuit to transform India’s coal sector, the union government is spearheading a ...

Reducing Coal Imports, Boosting Exports

The Ministry of Coal spearheading a transformative initiative to reduce coal imports and promote coal ...

Production of coal

Most of the demand of coal in the country is met through indigenous production/supply. The ...

Government provides incentives to small tea growers

The Tea Development & Promotion Scheme for the period 2023-24 to 2025-26 inter alia includes ...

Combined Index of Eight Core Industries (ICI) increases by 5.2 per cent (provisional) in March, 2024 as compared to March, 2023

The combined Index of Eight Core Industries (ICI) increased by 5.2 per cent (provisional) in March, 2024 ...

Index Numbers of Wholesale Price in India for the Month of March, 2024 (Base Year: 2011-12)

The annual rate of inflation based on all India Wholesale Price Index (WPI) number is ...

WP2Social Auto Publish Powered By : XYZScripts.com