India’s overall exports (Merchandise and Services combined) in April-January2020-21* are estimated to be USD 396.60Billion, exhibiting a negative growth of (-) 10.63per cent over the same period last year. Overall imports in April-January 2020-21* are estimated to be USD 398.47Billion, exhibiting a negative growth of (-) 22.80per cent over the same period last year.
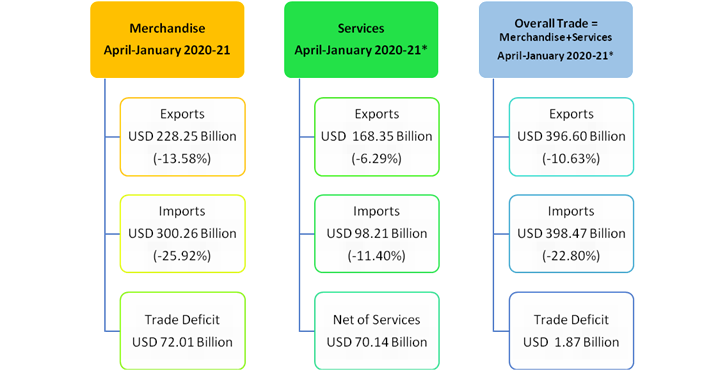
*Note: i) The latest data for services sector released by RBI is for December 2020. The data for January 2021 is an estimation, which will be revised based on RBI’s subsequent release ii) the figures in bracket are growth rates vis-à-vis corresponding period of last year.
I. MERCHANDISE TRADE
EXPORTS (including re-exports)
- Exports inJanuary2021 were USD27.45Billion, as compared to USD25.85Billion in January 2020, exhibiting a positive growth of 6.16per cent. In Rupee terms, exports were Rs. 2,00,661.11Crore in January2021, as compared to Rs. 1,84,369.73Crore in January2020, registering a positive growth of 8.84per cent.
- The commodities/commodity groups which have recorded positive growth during January 2021 vis-à-vis January 2020 areOther cereals (343.57%), Oil meals (257.50%), Iron Ore (108.84%), Cereal preparations & miscellaneous processed items (44.88%), Jute mfg. including floor covering (27.68%), Rice (26.33%), Tobacco (26.16%), Fruits & vegetables (24.34%), Carpet (23.69%), Handicrafts excl. handmade carpet (21.09%), Spices (20.36%), Ceramic products & glassware (19.03%), Engineering goods (18.81%), Drugs & pharmaceuticals (16.42%), Electronic goods (16%), Tea (13.34%), Mica, Coal & other ores, minerals including processed minerals (11.89%), Cashew (11.82%), Plastic & Linoleum (10.40%), Cotton yarn/fabs./made-ups, handloom products etc. (7.08%), Coffee (4.85%), and Organic & Inorganic chemicals (2.55%).
- The commodities/commodity groups which have recorded negative growth during January 2021 vis-à-vis January 2020are Petroleum products (-32.06%), Leather & leather products (-18.6%), RMG of all Textiles (-10.73%), Man-made yarn/fabs./made-ups etc. (-9.62%), Meat, dairy & poultry products (-8.03%), Oil seeds (-6.49%), Marine products (-1.72%) and Gems & jewellery (-1.26%).
- Cumulative value of exports for the period April-January 2020-21 was USD228.25Billion (Rs.16,96,367.07Crore) as against USD264.13Billion (Rs.18,61,740.70Crore) during the period April-January 2019-20, registering a negative growth of (-) 13.58per cent in Dollar terms (negative growth of (-) 8.88per cent in Rupee terms).
- Non-petroleum and Non-Gems and Jewellery exports in January 2021 were USD22.44Billion, as compared to USD19.79Billion in January2020, registering a positive growth of 13.40per cent. Non-petroleum and Non-Gems and Jewellery exports in April-January 2020-21 were USD188.77Billion, as compared to USD197.94Billion for the corresponding period in 2019-20, which is a decrease of (-) 4.63 per cent.
IMPORTS
- Imports in January2021 were USD41.99Billion (Rs.3,06,951.56Crore), which is an increase of2.03per cent in Dollar terms and 4.60per cent in Rupee terms over imports of USD41.15Billion (Rs2,93,452.69Crore) in January2020. Cumulative value of imports for the period April-January 2020-21 was USD300.26Billion (Rs.22,29,742.05Crore), as against USD405.33Billion (Rs.28,55,992.59Crore) during the period April-January 2019-20, registering a negative growth of (-) 25.92per cent in Dollar terms and a negative growth of (-)21.93per cent in Rupee terms.
- Major commodity groups of import showing negative growth in January2021 over the corresponding month of last year are:
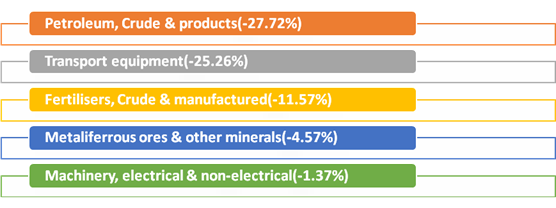
CRUDE OIL AND NON-OIL IMPORTS:
- Oil imports inJanuary2021 were USD9.40Billion (Rs. 68,743.95Crore), which was 27.72percentlower in Dollar terms (25.90percent lower in Rupee terms), compared to USD13.01Billion (Rs. 92,773.42Crore) in January2020. Oil imports inApril-January 2020-21 were USD63.09Billion (Rs.4,68,720.80Crore) which was 42.50per cent lower in Dollar terms (39.39percent lower in Rupee terms) compared to USD109.72Billion (Rs. 7,73,394.28Crore), over the same period last year.
- In this connection it is mentioned that the global Brent price ($/bbl) has decreased by 14.23% in January2021 vis-à-vis January2020 as per data available from World Bank.
- Non-oil imports inJanuary2021 were estimated at USD32.58Billion (Rs. 2,38,207.61Crore) which was 15.79percent higher in Dollar terms (18.70percent higher in Rupee terms), compared to USD28.14Billion (Rs. 2,00,679.27Crore) in January2020. Non-oil imports inApril-January 2020-21 were USD237.16Billion (Rs. 17,61,021.25Crore) which was 19.77per cent lower in Dollar terms (15.44percent lower in Rupee terms), compared to USD295.61Billion (Rs. 20,82,598.31Crore) in April-January2019-20.
- Non-Oil and Non-Gold imports wereUSD28.55Billion in January2021, recording a positive growth of 7.50per cent, as compared to Non-Oil and Non-Gold importsof USD 26.56Billion in January2020. Non-Oil and Non-Gold imports wereUSD216.34Billion in April-January 2020-21, recording a negative growth of (-) 20.16per cent, as compared to Non-Oil and Non-Gold imports ofUSD 270.97Billion in April-January 2019-20.
II. TRADE IN SERVICES
EXPORTS (Receipts)
- As per the latest press release by RBI dated 15thFebruary 2021, exports in December2020 were USD 18.72Billion (Rs.1,37,774.58Crore) registering a negative growth of (-) 6.41per cent in Dollar terms, vis-à-vis December2019. The estimated value of services export for January2021* is USD 19.25Billion.
IMPORTS (Payments)
- As per the latest press release by RBI dated 15th February 2021, imports in December 2020 were USD 11.50Billion (Rs. 84,632.64Crore) registering a negative growth of (-) 8.40per cent in Dollar terms, vis-à-vis December2019. The estimated value of servicesimport for January2021* is USD 12.03Billion.
III.TRADE BALANCE
- MERCHANDISE: The trade deficit for January2021 was estimated at USD14.54Billion as against the deficit of USD15.30Billion inJanuary2020, which is decrease of (-) 4.95 percent.
- SERVICES: As per RBI’s Press Release dated 15th February 2021, the trade balance in Services (i.e. Net Services export) for December 2020 is USD7.22Billion. The estimated trade balance in January 2021* is USD 7.22Billion.
- OVERALL TRADE BALANCE: Taking merchandise and services together, overall trade deficit for April-January 2020-21* is estimated at USD1.87Billion as compared to the deficit of USD72.40Billion in April-January 2019-20.
*Note: The latest data for services sector released by RBI is for December2020. The data for January2021 is an estimation, which will be revised based on RBI’s subsequent release.
MERCHANDISE TRADE
| EXPORTS &IMPORTS : (US $ Billion) | ||
| (PROVISIONAL) | ||
| JANUARY | APRIL-JANUARY | |
| EXPORTS(including re-exports) | ||
| 2019-20 | 25.85 | 264.13 |
| 2020-21 | 27.45 | 228.25 |
| %Growth 2020-21/ 2019-20 | 6.16 | -13.58 |
| IMPORTS | ||
| 2019-20 | 41.15 | 405.33 |
| 2020-21 | 41.99 | 300.26 |
| %Growth 2020-21/ 2019-20 | 2.03 | -25.92 |
| TRADE BALANCE | ||
| 2019-20 | -15.30 | -141.21 |
| 2020-21 | -14.54 | -72.01 |
| EXPORTS &IMPORTS: (Rs. Crore) | ||
| (PROVISIONAL) | ||
| JANUARY | APRIL-JANUARY | |
| EXPORTS(including re-exports) | ||
| 2019-20 | 1,84,369.73 | 18,61,740.70 |
| 2020-21 | 2,00,661.11 | 16,96,367.07 |
| %Growth 2020-21/ 2019-20 | 8.84 | -8.88 |
| IMPORTS | ||
| 2019-20 | 2,93,452.69 | 28,55,992.59 |
| 2020-21 | 3,06,951.56 | 22,29,742.05 |
| %Growth 2020-21/ 2019-20 | 4.60 | -21.93 |
| TRADE BALANCE | ||
| 2019-20 | -1,09,082.96 | -9,94,251.89 |
| 2020-21 | -1,06,290.45 | -5,33,374.98 |
SERVICES TRADE
| EXPORTS & IMPORTS (SERVICES) : (US $ Billion) | ||
| (PROVISIONAL) | December 2020 | April-December 2020-21 |
| EXPORTS (Receipts) | 18.72 | 149.09 |
| IMPORTS (Payments) | 11.50 | 86.18 |
| TRADE BALANCE | 7.22 | 62.91 |
| EXPORTS & IMPORTS (SERVICES): (Rs. Crore) | ||
| (PROVISIONAL) | December 2020 | April-December 2020-21 |
| EXPORTS (Receipts) | 1,37,774.58 | 11,12,700.22 |
| IMPORTS (Payments) | 84,632.64 | 6,43,016.41 |
| TRADE BALANCE | 53,141.94 | 4,69,683.82 |
| Source: RBI Press Release dated 15th February 2021 | ||
Quick Estimates January 2021 Click here