 Indian Industry Plus A Pratisrutiplus Suppliment






Key highlights of ICI for the month of October 2026
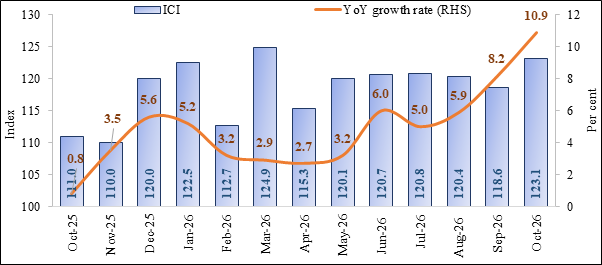
- The Index of Core Industries (ICI) grew by 10.9 per cent in October 2026 (Provisional) on a year-on-year basis, compared with October 2025. This is higher than the growth rate of 8.2 per cent recorded in September 2026 (Final Index).
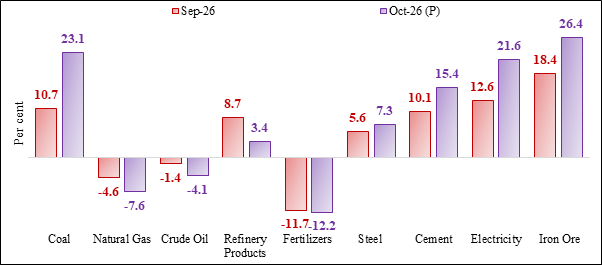
- Iron Ore, Coal, Electricity, Cement, Steel, and Refinery Products observed (Y-o-Y) growth rate of 26.4 per cent, 23.1 per cent, 21.6 per cent, 15.4 per cent, 7.3 per cent, and 3.4 per cent, respectively, whereas Natural Gas, Crude Oil, and Fertilizers witnessed negative growth in October 2026.
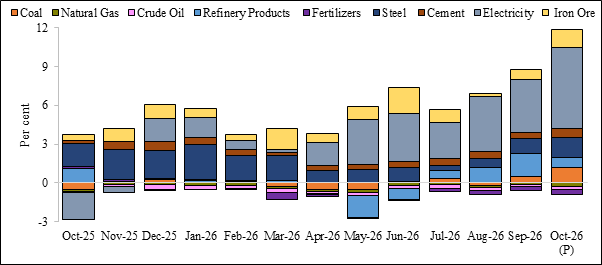
- Iron Ore, Electricity, Cement, Coal and Steel have been the major drivers of overall growth of ICI during recent months.
- Cumulative growth rate of ICI during April-October 2026 was 6.0 per cent (Provisional) compared to 2.3 per cent in the corresponding period of the previous year.
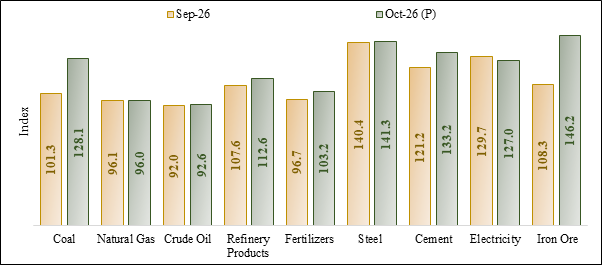
- The charts (1 to 4) below show trend in ICI and its growth rate for the last 13 months, industry-wise indices and growth rates for September and October 2026, and sector-wise contribution to overall ICI growth for the last 13 months.
Chart 1: ICI and Growth Rate
(P)-Provisional
Chart 2: Sector-wise Index in September and October 2026
(P)-Provisional
Chart 3: Sector-wise Growth Rate in September and October 2026
(P)-Provisional
Chart 4: Sector-wise Contribution to Growth
(P)-Provisional
- The final index for the month of September 2026 has been revised from 118.3 (Provisional) to 118.6. Accordingly, YoY growth rate has been revised from 7.9 per cent to 8.2 per cent.
- Index of Core Industries, and Year-on-Year (YoY) growth rate for the last 13 months is given at Annexure-I and Annexure-II. ICI for the months of April 2023 onward have been placed on the web portal of OEA at web link (https://eaindustry.nic.in/ici_download_data.asp).
- Annual and Cumulative Index and YoY growth rate is given at Annexure-III and Annexure-IV.
- Release Schedule: Provisional index of ICI for a reference month is released on the 20th of the following month (if it is a working day, else on next working day). Accordingly, the ICI for the month of November 2026 will be released on Monday, 21st December 2026.
Annexure-I
Table 1: Index of Core Industries for last 13 months
| Sector | Coal | Natural Gas | Crude Oil | Refinery Products | Fertilizers | Steel | Cement | Electricity | Iron Ore | Overall Index |
| Weight | 5.596 | 3.841 | 7.43 | 22.572 | 2.731 | 17.584 | 4.41 | 30.932 | 4.905 | 100.00 |
| Oct-25 | 104.1 | 103.9 | 96.6 | 108.9 | 117.5 | 131.7 | 115.4 | 104.4 | 115.7 | 111.0 |
| Nov-25 | 124.6 | 102.1 | 93.9 | 105.1 | 114.9 | 131.3 | 119.0 | 97.9 | 134.6 | 110.0 |
| Dec-25 | 136.5 | 103.2 | 96.5 | 113.1 | 116.3 | 141.4 | 141.2 | 110.6 | 146.5 | 120.0 |
| Jan-26 | 141.5 | 102.5 | 96.2 | 112.5 | 115.2 | 148.1 | 143.3 | 114.5 | 146.7 | 122.5 |
| Feb-26 | 133.9 | 91.9 | 86.7 | 101.2 | 103.3 | 134.7 | 137.6 | 107.1 | 137.3 | 112.7 |
| Mar-26 | 152.9 | 101.2 | 95.7 | 113.1 | 76.5 | 149.2 | 151.1 | 119.5 | 160.6 | 124.9 |
| Apr-26 | 99.8 | 98.0 | 93.4 | 100.6 | 82.5 | 134.3 | 129.5 | 122.9 | 137.1 | 115.3 |
| May-26 | 105.0 | 99.6 | 95.8 | 100.3 | 101.2 | 137.5 | 132.5 | 131.2 | 148.5 | 120.1 |
| Jun-26 | 107.6 | 97.0 | 92.5 | 101.5 | 102.3 | 136.8 | 138.4 | 132.3 | 148.7 | 120.7 |
| Jul-26 | 93.8 | 101.3 | 94.0 | 111.6 | 104.0 | 139.6 | 128.7 | 133.6 | 104.8 | 120.8 |
| Aug-26 | 89.8 | 99.5 | 94.7 | 111.6 | 100.7 | 140.6 | 122.4 | 135.1 | 96.1 | 120.4 |
| Sep-26 | 101.3 | 96.1 | 92.0 | 107.6 | 96.7 | 140.4 | 121.2 | 129.7 | 108.3 | 118.6 |
| Oct-26 (P) | 128.1 | 96.0 | 92.6 | 112.6 | 103.2 | 141.3 | 133.2 | 127.0 | 146.2 | 123.1 |
Data for October 2026 is Provisional
Annexure-II
Table 2: YoY Growth Rate of ICI for last 13 months
| Sector | Coal | Natural Gas | Crude Oil | Refinery Products | Fertilizers | Steel | Cement | Electricity | Iron Ore | Overall Index |
| Weight | 5.596 | 3.841 | 7.43 | 22.572 | 2.731 | 17.584 | 4.41 | 30.932 | 4.905 | 100.00 |
| Oct-25 | -8.4 | -5.2 | -0.8 | 5.3 | 7.4 | 9.5 | 5.2 | -7.0 | 8.7 | 0.8 |
| Nov-25 | 2.2 | -2.5 | -2.6 | -0.2 | 5.5 | 11.6 | 15.1 | -1.5 | 19.3 | 3.5 |
| Dec-25 | 3.7 | -4.4 | -5.1 | -0.3 | 4.1 | 11.1 | 14.0 | 6.2 | 22.3 | 5.6 |
| Jan-26 | 0.9 | -4.9 | -5.4 | 0.4 | 3.7 | 13.8 | 11.3 | 5.1 | 12.8 | 5.2 |
| Feb-26 | 1.4 | -5.0 | -4.8 | -0.4 | 3.5 | 9.9 | 9.1 | 2.3 | 8.5 | 3.2 |
| Mar-26 | -4.0 | -3.7 | -5.3 | 0.9 | -24.6 | 9.6 | 4.7 | 0.8 | 33.3 | 2.9 |
| Apr-26 | -9.0 | -4.2 | -3.2 | -0.2 | -8.5 | 4.7 | 8.3 | 5.5 | 12.5 | 2.7 |
| May-26 | -9.5 | -5.0 | -4.2 | -8.2 | -1.0 | 5.1 | 8.4 | 11.2 | 19.0 | 3.2 |
| Jun-26 | 1.4 | -4.8 | -4.2 | -4.0 | -3.3 | 5.6 | 9.9 | 11.4 | 44.5 | 6.0 |
| Jul-26 | 7.6 | -3.0 | -5.3 | 3.0 | -8.0 | 1.9 | 12.7 | 8.4 | 29.5 | 5.0 |
| Aug-26 | -3.8 | -4.9 | -3.6 | 5.6 | -12.4 | 3.5 | 11.7 | 13.1 | 5.5 | 5.9 |
| Sep-26 | 10.7 | -4.6 | -1.4 | 8.7 | -11.7 | 5.6 | 10.1 | 12.6 | 18.4 | 8.2 |
| Oct-26 (P) | 23.1 | -7.6 | -4.1 | 3.4 | -12.2 | 7.3 | 15.4 | 21.6 | 26.4 | 10.9 |
Data for October 2026 is Provisional
Annexure-III
Table 3: Annual and Cumulative Index of Core Industries
| Sector | Coal | Natural Gas | Crude Oil | Refinery Products | Fertilizers | Steel | Cement | Electricity | Iron Ore | Overall Index |
| Weight | 5.596 | 3.841 | 7.43 | 22.572 | 2.731 | 17.584 | 4.41 | 30.932 | 4.905 | 100.00 |
| 2023-24 | 111.7 | 106.1 | 100.6 | 103.6 | 103.7 | 113.6 | 108.9 | 107.1 | 107.3 | 107.2 |
| 2024-25 | 117.3 | 105.7 | 98.4 | 106.5 | 106.7 | 121.8 | 115.9 | 112.6 | 112.2 | 111.8 |
| 2025-26 | 116.4 | 102.0 | 95.8 | 106.9 | 106.6 | 135.9 | 125.8 | 113.8 | 121.2 | 115.2 |
| Apr-Oct 25 | 101.1 | 103.2 | 97.2 | 105.4 | 107.6 | 132.3 | 116.7 | 116.5 | 104.1 | 113.1 |
| Apr-Oct 26 | 103.6 | 98.2 | 93.6 | 106.5 | 98.7 | 138.6 | 129.4 | 130.3 | 127.1 | 119.9 |
Data for April-October 2026 is Provisional
Annexure-IV
Table 3: YoY Growth Rate of Annual and Cumulative Index of Core Industries
| Sector | Coal | Natural Gas | Crude Oil | Refinery Products | Fertilizers | Steel | Cement | Electricity | Iron Ore | Overall Index |
| Weight | 5.596 | 3.841 | 7.43 | 22.572 | 2.731 | 17.584 | 4.41 | 30.932 | 4.905 | 100.00 |
| 2024-25 | 5.0 | -0.4 | -2.2 | 2.8 | 2.9 | 7.2 | 6.4 | 5.1 | 4.6 | 4.3 |
| 2025-26 | -0.8 | -3.5 | -2.6 | 0.4 | -0.1 | 11.6 | 8.5 | 1.1 | 8.0 | 3.0 |
| Apr-Oct 25 | -2.0 | -3.3 | -1.2 | 0.6 | 0.7 | 11.8 | 6.9 | -0.1 | -1.1 | 2.3 |
| Apr-Oct 26 | 2.5 | -4.8 | -3.7 | 1.0 | -8.3 | 4.8 | 10.9 | 11.8 | 22.1 | 6.0 |
Data for April-October 2026 is Provisional