TRAI today has released the “Indian Telecom Services Performance Indicator Report” for the Quarter ending 31st December, 2025. This Report provides a broad perspective of the Telecom Services in India and presents the key parameters and growth trends of the Telecom Services as well as Cable TV, DTH & Radio Broadcasting services in India for the period covering 1st October, 2025 to 31st December, 2025 compiled mainly on the basis of information furnished by the Service Providers.
Executive Summary of the Report is enclosed. The complete Report is available on TRAI’s website (www.trai.gov.in and under the link http://www. trai.gov.in/release-publication/reports/performance-indicators-reports). Any suggestion or any clarification pertaining to this report, Shri Vijay Kumar, Advisor (F&EA), TRAI may be contacted on Tel. +91-20907773 and e-mail: fea1-div@trai.gov.in.
The Indian Telecom Services Performance Indicators
October–December, 2025
Executive Summary
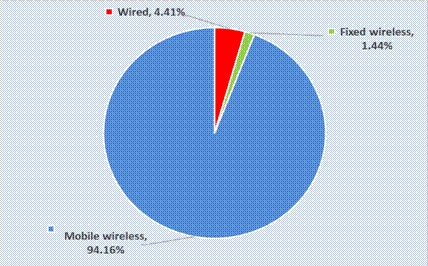
- Total number of Internet subscribers increased from 1017.81 million at the end of Sep-25 to 1028.61 million at the end of Dec-25, registering a quarterly rate of growth 1.06%. Out of 1,028.61 million internet subscribers, number of Wired Internet subscribers are 45.32 million and number of Wireless Internet subscribers are 983.29 million.
Composition of internet subscription
- The Internet subscriber base is comprised of Broadband Internet subscriber base of 1007.35 million and Narrowband Internet subscriber base of 21.25 million.
- The broadband Internet subscriber base increased by 1.18% from 995.63 million at the end of Sep-25 to 1007.35 million at the end of Dec-25. The narrowband Internet subscriber base decreased by 4.18% from 22.18 million at the end of Sep-25 to 21.25 million at the end of Dec-25.
- Wireline subscribers inreased from 46.61 million at the end of Sep-25 to 47.37 million at the end of Dec-25 with a quarterly rate of growth 1.62%. On Y-O-Y basis, wireline subscriptions increased by 20.63% at the end of QE Dec-25.
- Wireline Tele-density increased from 3.29% at the end of Sep-25 to 3.33% at the end of Dec-25 with quarterly rate of growth 1.23%.
- Monthly Average Revenue per User (ARPU) for wireless service increased by 1.87%, from Rs.190.99 in QE Sep-25 to Rs.194.57 in QE Dec-25. On Y-O-Y basis, monthly ARPU for wireless service increased by 7.03% in this quarter.
- The ARPU per month for the pre-paid segment is Rs.194.12 and the ARPU per month for the post-paid segment is Rs.199.05 for Q.E. Dec-25.
- On an all-India average, the overall MOU per month increased by 0.72% from 1005 in Q.E. Sep-25 to 1012 in Q.E. Dec-25.
- Prepaid MOU per subscriber is 1064 and Postpaid MOU per subscriber per month is 501 in QE Dec-25.
- Gross Revenue (GR), Applicable Gross Revenue (ApGR) and Adjusted Gross Revenue (AGR) of Telecom Service Sector for the Q.E. Dec-25 has been Rs.1,02,475 Crore, Rs.96,456 crore and Rs.84,270 Crore respectively. GR increased by 2.65%, ApGR by 2.28% and AGR increased by 2.33% in Q.E. Dec-25, as compared to previous quarter.
- The Y-O-Y rate of growth in GR, ApGR and AGR in Q.E. Dec-25 over the same quarter in last year have been 6.31%, 4.46% and 8.13% respectively.
- Pass Through Charges decreased from Rs.11,426 Crore in QE Sep-25 to Rs.11,296 Crore in QE Dec-25 with quarterly rate of decline of 1.13%. The Y-O-Y rate of decline 21.61% has been recorded in pass-through charges for QE Dec-25.
- The License Fee increased from Rs.6,588 Crore for the QE Sep-25 to Rs.6,733 Crore for the QE Dec-25. The quarterly and the Y-O-Y rates of growth in license fees are 2.20% and 8% respectively in this quarter.
Service-wise composition of Adjusted Gross Revenue
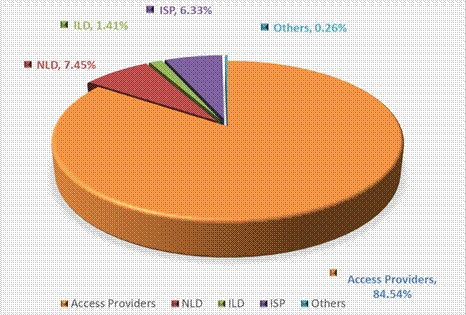
- Access services contributed 84.54% of the total Adjusted Gross Revenue of telecom services. In Access services, Gross Revenue (GR), Applicable Gross Revenue (ApGR), Adjusted Gross Revenue (AGR), License Fee, Spectrum Usage Charges (SUC) and Pass Through Charges increased by 1.37%, 1.89%, 2.91%, 2.91%, 2.46% and -6.37% respectively in QE Dec-25.
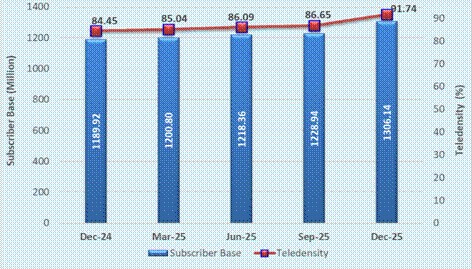
- The number of total telephone subscribers in India increased from 1,228.94 million at the end of Sep-25 to 1,306.14 million at the end of Dec-25, registering a rate of growth 6.28% over the previous quarter. This reflects Year-On-Year (Y-O-Y) rate of growth 9.77% over the same quarter of the last year. The overall Tele-density in India increased from 86.65% in QE Sep-25 to 91.74% in QE Dec-25.
Trends in Telephone subscribers and Tele-density in India
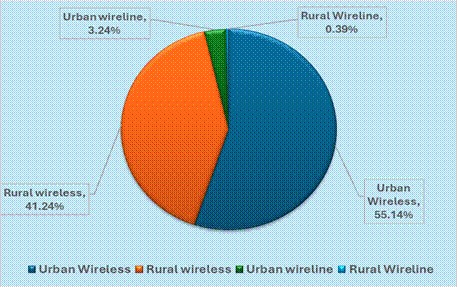
- Telephone subscribers in Urban areas increased from 689.11 million at the end of Sep-25 to 762.44 million at the end of Dec-25 and Urban Tele-density also increased from 134.76% to 148.92% during the same period.
- Rural telephone 539.83 million at the end of Sep-25 to 543.70 million at the end of Dec-25 and Rural Tele-density also increased from 59.52% to 59.63% during the same period.
- Out of the total subscription, the share of Rural subscription decreased from 43.93% at the end of Sep-25 to 41.63% at the end of Dec-25.
Composition of Telephone Subscribers
 With a net addition of 76.45 million subscribers during the quarter, the total wireless (mobile + FWA) subscriber base increased from 1182.32 million at the end of Sep-25 to 1258.77 million at the end of Dec-25, registering a rate of growth 6.47% over the previous quarter. On Y-O-Y basis, wireless subscriptions increased at the rate of 9.40% during the year.
- Wireless (mobile + FWA) Tele-density increased from 83.36% at the end of Sep-25 to 88.41% at the end of Dec-25 with quarterly rate of growth 6.05%.
- With a net addition of 73.76 million subscribers during the quarter, the wireless (mobile) subscriber base increased from 1170.44 million at the end of Sep-25 to 1244.20 million at the end of Dec-25, registering a rate of growth 6.30% over the previous quarter. On Y-O-Y basis, wireless subscriptions also increased at the rate of 8.13% during the year.
- Wireless (mobile) Tele-density increased from 82.53% at the end of Sep-25 to 87.38% at the end of Dec-25 with quarterly rate of growth of 5.89%.
- During this quarter, the following parameters in terms of QoS benchmarks have been fully complied with by wireline service providers in all the LSAs: –
| S. No. | Parameter | Benchmark |
| 1 | Provision of a service within 7 working days of payment of demand note by the customer | ≥ 98% |
| 2 | Fault incidences (No. of faults per 100 subscribers) | ≤ 5 |
| 3 | Point of Interconnection (POI) Congestion (90th percentile value) | ≤ 0.5% |
| 4 | Billing and charging complaints | ≤ 0.1% |
| 5 | Resolution of billing/ charging complaints within four weeks | 100% |
| 6 | Application of adjustment to customer’s account within one week from the date of resolution of billing and charging complaints or rectification of faults or rectification of significant network outage, as applicable | 100% |
| 7 | Accessibility of call centre/customer care | ≥ 95% |
| 8 | Percentage of calls answered by the operators (voice to voice) within 90 seconds | ≥ 95% |
| 9 | Termination/ closure of service within seven working days of receipt of customer’s request | 100% |
- During this quarter, list of QoS parameters which are fully complied with by all the Access Service (Wireless) providers in all the LSAs: –
| S. No. | Parameter | Benchmark |
| 1 | Availability of service wise geospatial coverage map on service provider’s website for percentage of working cells | ≥ 99% |
| 2 | Cumulative downtime (Cells not available for service) | ≤ 1.5 % |
| 3 | Worst Affected Cells due to downtime | ≤ 1.5 % |
| 4 | Percentage of significant network outage (services not available in a district for more than 4 hours) reported to the Authority within 24 hrs of start of the outage | 100% |
| 5 | Call Set-up Success Rate: Intra- Service provider (within service provider’s network) | ≥ 98% |
| 6 | Call Set-up Success Rate: Inter- Service provider (incoming from other service providers’ network) | ≥ 95% |
| 7 | Point of Interconnection (POI) Congestion (90th percentile value) | ≤ 0.5% |
| 8 | DCR Spatial Distribution Measure for Circuit Switched (2G/3G) network [CS_QSD (88, 88)] | ≤ 2% |
| 9 | DCR Spatial Distribution Measure for Packet Switched (4G/5G and beyond) network [PS_QSD (93, 93)] |
≤ 2% |
| 10 | Downlink Packet Drop Rate for Packet Switched Network (4G/5G and beyond) [DLPDR_QSD (88, 88)] | ≤ 2% |
| 11 | Uplink Packet Drop Rate for Packet Switched Network (4G/5G and beyond) [ULPDR_QSD (88, 88)] | ≤ 2% |
| 12 | Latency (in 4G and 5G network) | ≤ 75 msec |
| 13 | Packet Drop Rate (in 4G and 5G network) | ≤ 3% |
| 14 | Percentile value of measured test samples for which download and upload speed is ≥ offered typical download and upload speed in tariff offerings | 80th percentile |
| 15 | Billing and charging complaints | ≤ 0.1% |
| 16 | Resolution of billing/ charging complaints within four weeks | 100% |
| 17 | Application of adjustment to customer’s account within one week from the date of resolution of billing and charging complaints or rectification of faults or rectification of significant network outage, as applicable | 100% |
| 18 | Termination/ closure of service within seven working days of receipt of customer’s request | 100% |
| 19 | Refund of deposits within 45 days of closure of service or non-provisioning of service | 100% |
- List of QoS parameters which are fully complied with by all the Broadband (Wireline) Service providers in all the service areas: –
| S. No. | Parameter | Benchmark |
| 1. | Latency | ≤ 50 msec |
| 2. | Packet Drop Rate | ≤ 1% |
| 3. | Percentile value of measured test samples for which download and upload speed is ≥ offered typical download and upload speed in tariff offerings | 90th percentile |
| 4. | Maximum Bandwidth utilization of any Customer serving node to ISP Gateway Node [Intra-network] or Internet Exchange Point Link(s) | ≤ 80% |
| 5. | Jitter | ≤ 40ms |
| 6. | Resolution of billing/ charging complaints within four weeks | 100% |
| 7. | Accessibility of call centre/ customer care | ≥ 95% |
- A total of 920 private satellite TV channels have been permitted by the Ministry of Information and Broadcasting (MIB) for uplinking only/downlinking only/both uplinking & downlinking.
- As per the reporting done by broadcasters in pursuance of the Tariff Order dated 3rd March 2017, as amended, out of 911 permitted satellite TV channels which are available for downlinking in India, there are 335 satellite pay TV channels as on 31st December, 2025. Out of 335 pay channels, 232 are SD satellite pay TV channels and 103 are HD satellite pay TV channels. Apart from these pay channels reported to TRAI, remaining 576 channels, permitted by MIB, are considered as Free-to-Air (FTA) channels.
- During QE December 2025, there were 4 pay DTH service providers in the country. As per the data reported by these DTH operators, pay DTH has attained a total active subscriber base of around 50.99 million as on 31st December 2025. This is in addition to the subscribers of the DD Free Dish (free DTH services of Prasar Bharati). The total active subscriber base of pay DTH services has declined from 52.78 million in the quarter ending September 2025 to 50.99 million in the quarter ending December 2025.
- Apart from the radio channels operated by All India Radio, the public broadcaster, as per the data reported by FM Radio operators to TRAI, as on 30th September 2025, there were 387 operational private FM Radio channels in 113 cities operated by 31 private FM Radio operators. During the quarter ended 31st December 2025, M/s South Asia FM surrendered the permission for its FM radio station in Mumbai, Maharashtra. Further, M/s Next Radio Limited surrendered the permission for its FM radio station in Chennai, Tamil Nadu. Now, 08 channels are operational in the city of Mumbai & 06 channels are operational in the city of Chennai. Therefore, as on 31st December 2025, there are 385 operational private FM radio channels across 113 cities, operated by 31 private FM radio operators.
- The advertisement revenue reported by FM Radio operators during the quarter ending 31st December 2025 in respect of 385 private FM Radio channels is Rs 419.29 crore as against Rs 399.96 crore in respect of 387 private FM Radio channels for the previous quarter i.e. 30th September 2025.
- As on 31st December, 2025, 557 Community Radio stations are operational
SNAPSHOT
| (Data as on Q.E. 31st December 2025) | |
| Telecom Subscribers (Wireless+Wireline) | |
| Total Subscribers | 1,306.14 million |
| % change over the previous quarter | 6.28%* |
| Urban Subscribers | 762.44 million |
| Rural Subscribers | 543.70 million |
| Market share of Private Operators | 92.17% |
| Market share of PSU Operators | 7.83% |
| Tele-density | 91.74% |
| Urban Tele-density | 148.92% |
| Rural Tele-density | 59.63% |
| Wireless (Mobile+FWA) Subscribers | |
| Wireless (Mobile) Subscribers | 1,244.20 million |
| Wireless (5G FWA+UBR FWA) Subscribers | 14.57 million |
| Total Wireless Subscribers | 1,258.77 million |
| % change over the previous quarter | 6.47%* |
| Urban Subscribers | 720.15 million |
| Rural Subscribers | 538.62 million |
| Market share of Private Operators | 92.61% |
| Market share of PSU Operators | 7.39% |
| Tele-density | 88.41% |
| Urban Tele-density | 140.66% |
| Rural Tele-density | 59.07% |
| Total Wireless Data Usage during the quarter | 73,324 PB |
| Number of Public Mobile Radio Trunk Services (PMRTS) | 65,515 |
| Number of Very Small Aperture Terminals (VSAT) | 2,09,683 |
| Wireline Subscribers | |
| Total Wireline Subscribers | 47.37 million |
| % change over the previous quarter | 1.62% |
| Urban Subscribers | 42.29 million |
| Rural Subscribers | 5.08 million |
| Market share of PSU Operators | 19.70% |
| Market share of Private Operators | 80.30% |
| Tele-density | 3.33% |
| Rural Tele-density | 0.56% |
| Urban Tele-density | 8.26% |
| No. of Public Call Office (PCO) | 4,937 |
| Telecom Financial Data | |
| Gross Revenue (GR) during the quarter | Rs. 1,02,475 crore |
| % change in GR over the previous quarter | 2.65% |
| Applicable Gross Revenue (ApGR) during quarter | Rs. 96,456 crore |
| % change in ApGR over the previous quarter | 2.28% |
| Adjusted Gross Revenue (AGR) during the quarter | Rs. 84,270 crore |
| % change in AGR over the previous quarter | 2.33% |
| Share of Public sector undertakings in Access AGR | 2.87% |
| Internet/Broadband Subscribers | |
| Total Internet Subscribers | 1028.61 million |
| % change over previous quarter | 1.06% |
| Narrowband subscribers | 21.25 million |
| Broadband subscribers | 1007.35 million |
| Fixed (Wired) Access Internet Subscribers | 45.32 million |
| Wireless (Fixed+Mobile) Access Internet Subscribers | 983.29 million |
| Urban Internet Subscribers | 594.33 million |
| Rural Internet Subscribers | 434.27 million |
| Total Internet Subscribers per 100 population | 72.24% |
| Urban Internet Subscribers per 100 population | 116.09% |
| Rural Internet Subscribers per 100 population | 47.63% |
| Total Outgoing Minutes of Usage for Internet Telephony | 68.08 million |
| No. of Public Wi-Fi Hotspots | 55,483 |
| Aggregate Data Consumed (TB) for Wi-Fi Hotspots | 11,805 TB |
| Broadcasting & Cable Services | |
| Number of private satellite TV channels permitted by the Ministry of I&B for uplinking only/downlinking only/both uplinking and downlinking | 920 |
| Number of Pay TV Channels as reported by broadcasters | 335 |
| Number of private FM Radio Channels (excluding All India Radio) | 385 |
| Number of total active subscribers with pay DTH operators | 50.99 million |
| Number of Operational Community Radio Stations | 557 |
| Number of pay DTH Operators | 4 |
| Revenue & Usage Parameters | |
| **Monthly ARPU of Wireless Service | Rs.194.57 |
| Minutes of Usage (MOU) per subscriber per month – Wireless Service | 1012 |
| Wireless Data Usage | |
| Average Wireless Data Usage per wireless data subscriber per month | 25.70 GB |
| Average revenue realization per GB for wireless data usage during the quarter | Rs.7.87 |
| Note: *Till the month of November 2025, M/S Bharti Airtel Limited was not including their M2M cellular subscriber base in their wireless (Mobile) subscriber base while the remaining operators were including their M2M cellular subscriber base in their wireless (Mobile) subscriber base. From this month of December 2025, M/S Bharti Airtel Limited has started including their M2M cellular subscriber base in their wireless (mobile) subscriber base. As a result, there has been a significant increase in the Total and wireless (mobile) subscriber base in the month of December 2025. | |