The total agri-food exports has grown from US$ 36.18 billion in 2014-15 to US$ 38.32 billion in 2020-21 at a compounded annual growth rate of 0.96 per cent. The gross value added in food processing sector has grown from Rs 1.34 Lakh Crore in 2014-15 to Rs. 2.24 Lakh Crore in 2019-20 at a compounded annual growth rate of 10.8 per cent.
As per latest data released by M/o Statistics &Programme Implementation, through the Annual Survey of Industries (2018-19), the details of total output of manufacturing of the food products & beverages for the last three years, state-wise is shown in the Table below. Data on turnover is not indicated in the Annual Survey of Industries.
| Output of Food Products & Beverages Manufacturing Output (in Rs Crore) | ||||
| Sr. No | State | 2016-17 | 2017-18 | 2018-19 |
| 1 | A & N Islands | 9.27 | 13.16 | 16.03 |
| 2 | Andhra Pradesh | 77373.79 | 87265.90 | 96068.39 |
| 3 | Arunachal Pradesh | 15256.80 | 280.10 | 295.12 |
| 4 | Assam | 285.85 | 15605.93 | 16494.10 |
| 5 | Bihar | 12739.40 | 15150.12 | 18067.90 |
| 6 | Chandigarh | 332.89 | 326.87 | 561.11 |
| 7 | Chhattisgarh | 14616.74 | 14317.56 | 18008.03 |
| 8 | Dadra & Nagar Haveli | 48.78 | 185.18 | 80.78 |
| 9 | Daman & Diu | 1204.92 | 1264.98 | 1572.23 |
| 10 | Delhi | 35690.16 | 19992.30 | 19243.36 |
| 11 | Goa | 3139.04 | 3203.57 | 3679.79 |
| 12 | Gujarat | 136474.67 | 128483.24 | 140898.69 |
| 13 | Haryana | 56411.20 | 55415.23 | 88761.59 |
| 14 | Himachal Pradesh | 7614.17 | 6327.49 | 5864.56 |
| 15 | Jammu and Kashmir | 3724.14 | 7078.98 | 5703.57 |
| 16 | Jharkhand | 3639.85 | 4624.99 | 4719.45 |
| 17 | Karnataka | 84625.41 | 94574.48 | 93517.96 |
| 18 | Kerala | 31061.91 | 38591.62 | 33941.19 |
| 19 | Madhya Pradesh | 45391.53 | 68933.31 | 68492.00 |
| 20 | Maharashtra | 126925.14 | 161807.09 | 185566.71 |
| 21 | Manipur | 59.36 | 104.23 | 129.30 |
| 22 | Meghalaya | 414.02 | 524.41 | 564.09 |
| 23 | Nagaland | 88.12 | 108.53 | 114.30 |
| 24 | Odisha | 10335.59 | 11107.29 | 14436.68 |
| 25 | Puducherry | 2319.29 | 3117.54 | 3051.87 |
| 26 | Punjab | 46742.97 | 48609.68 | 47760.07 |
| 27 | Rajasthan | 46921.27 | 48570.75 | 48810.65 |
| 28 | Sikkim | 653.41 | 662.72 | 1102.98 |
| 29 | Tamil Nadu | 92550.15 | 100515.63 | 90747.80 |
| 30 | Telangana | 28760.95 | 34167.95 | 41542.07 |
| 31 | Tripura | 486.07 | 486.71 | 617.66 |
| 32 | Uttar Pradesh | 129655.68 | 130139.44 | 142587.01 |
| 33 | Uttarakhand | 11802.27 | 16658.68 | 15014.53 |
| 34 | West Bengal | 67627.24 | 68280.81 | 68956.32 |
| All India | 1094982.05 | 1186496.47 | 1276987.89 | |
| Source: Annual Survey of Industries 2016-17, 2017-18, and 2018-19 | ||||
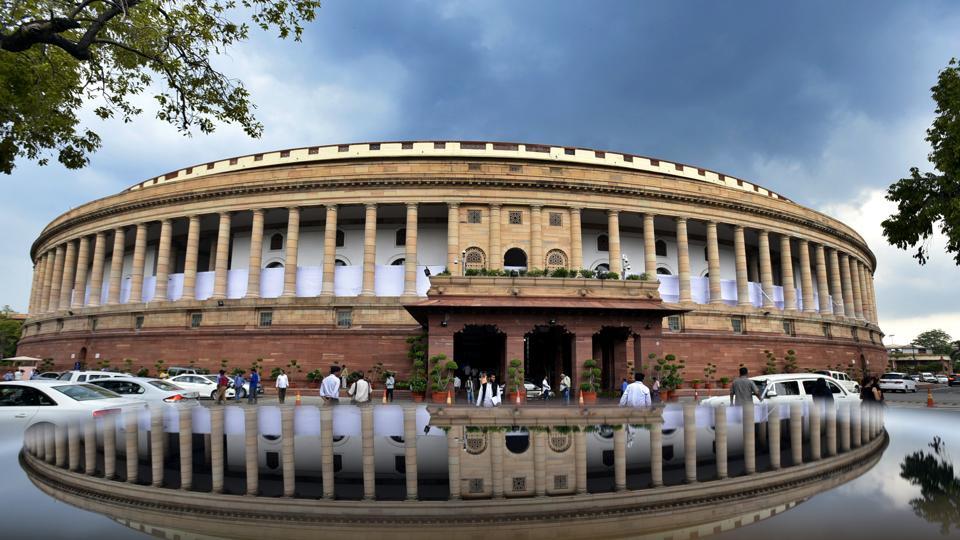
This information was given by Minister of State for M/o Food Processing Industries, Shri Prahlad Singh Patel in a written reply in Rajya Sabha
 Indian Industry Plus A Pratisrutiplus Suppliment


