India’s overall exports (Merchandise and Services combined) in April-September2020-21* are estimated to be USD 221.86Billion, exhibiting a negative growth of (-)16.66per cent over the same period last year. Overall imports in April-September 2020-21* are estimated to be USD 204.12Billion, exhibiting a negative growth of (-)35.43per cent over the same period last year.
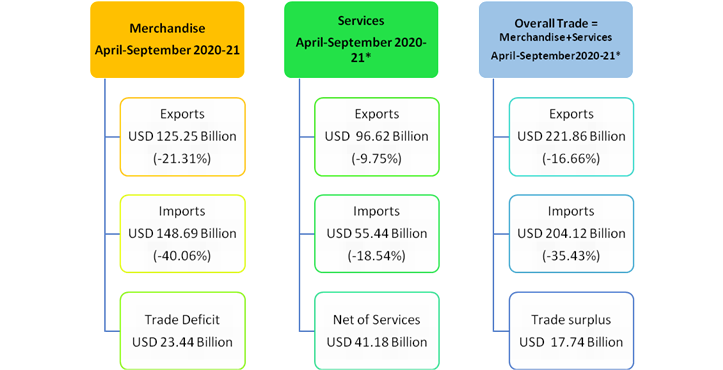
*Note: i) The latest data for services sector released by RBI is for August 2020. The data for September 2020 is an estimation, which will be revised based on RBI’s subsequent release ii) the figures in bracket are growth rates vis-à-vis corresponding period of last year.
I. MERCHANDISE TRADE
EXPORTS (including re-exports)
- Exports inSeptember2020 were USD27.58Billion, as compared to USD26.02Billion in September 2019, exhibiting a positive growth of 5.99per cent. In Rupee terms, exports were Rs. 2,02,694.07Crore in September2020, as compared to Rs. 1,85,642.32Crore in September2019, registering a positive growth of 9.19per cent.
- Major commodities/commodity groups which have recorded positive growth during September 2020 vis-à-vis September 2019 are Other cereals (337.22%), Iron Ore (109.65%), Rice (93.86%), Oil Meals (47.52%), Carpet (42.89%), Ceramic products & glassware (36.17%), Oil seeds (35.69%), Cereal preparations & miscellaneous processed items (33.57%), Drugs & pharmaceuticals (24.38%), Handicrafts excl. handmade carpet (21.82%), Meat, dairy & poultry products (19.97%), Jute mfg. including floor covering (18.64%), Cotton yarn/fabs./made-ups, handloom products etc. (15.39%), Spices (11.44%), Tobacco (11.09%) and RMG of all textiles (10.22%).
- Major commodities/commodity groups which have recorded negative growth during September 2020 vis-à-vis September 2019 are Cashew (-44.25%), Gems & jewellery (-24.67%), Man-made yarn/fabs./made-ups etc. (-9.12%), Mica, Coal & other ores, minerals including processed minerals (-6.71%), Marine products (-5.41%), Leather & leather products (-3.36%), Tea (-2.27%) and Fruits & Vegetables (-1.44%).
- Cumulative value of exports for the period April-September 2020-21 was USD125.25Billion (Rs.9,38,529.94Crore) as against USD159.16Billion (Rs.11,13,886.17Crore) during the period April-September 2019-20, registering a negative growth of (-)21.31per cent in Dollar terms (negative growth of (-)15.74per cent in Rupee terms).
- Non-petroleum and Non-Gems and Jewellery exports in September 2020 were USD21.27Billion, as compared to USD19.00Billion in September2019, registering a positive growth of 11.94per cent. Non-petroleum and Non-Gems and Jewellery exports in April-September 2020-21 were USD104.51Billion, as compared to USD118.65Billion for the corresponding period in 2019-20, which is a decrease of (-)11.92 per cent.
IMPORTS
- Imports in September2020 were USD30.31Billion (Rs.2,22,708.15Crore), which is a decline of(-) 19.60per cent lower in Dollar terms and (-) 17.18per cent in Rupee terms over imports of USD37.69Billion (Rs2,68,891.09Crore) in September2019. Cumulative value of imports for the period April-September 2020-21 was USD148.69Billion (Rs.11,14,686.58Crore), as against USD248.08Billion (Rs.17,35,550.99Crore) during the period April-September 2019-20, registering a negative growth of (-)40.06per cent in Dollar terms and a negative growth of (-)35.77per cent in Rupee terms.
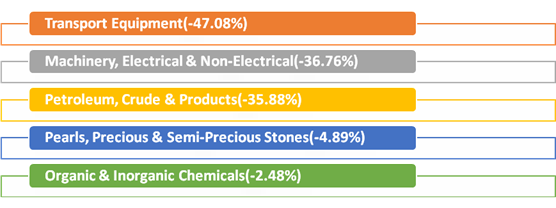
- Major commodity groups of import showing negative growth in September2020 over the corresponding month of last year are:
CRUDE OIL AND NON-OIL IMPORTS:
- Oil imports inSeptember2020 were USD5.83Billion (Rs. 42,812.35Crore), which was 35.88percentlower in Dollar terms (33.95percentlower in Rupee terms), compared to USD9.09Billion (Rs. 64,815.60Crore) in September2019. Oil imports inApril-September 2020-21 were USD31.86Billion (Rs. 2,38,995.70Crore) which was 51.14per cent lower in Dollar terms (47.60percent lower in Rupee terms) compared to USD65.20Billion (Rs. 4,56,108.64Crore), over the same period last year.
- In this connection it is mentioned that the global Brent price ($/bbl) has decreased by 34.08% in September2020 vis-à-vis September2019 as per data available from World Bank.
- Non-oil imports inSeptember2020 were estimated at USD24.48Billion (Rs. 1,79,895.80Crore) which was 14.43per cent lower in Dollar terms (11.85percentlower in Rupee terms), compared to USD28.61Billion (Rs. 2,04,075.49Crore) in September2019. Non-oil imports inApril-September 2020-21 were USD116.83Billion (Rs. 8,75,690.88Crore) which was 36.12per cent lower in Dollar terms (31.56percent lower in Rupee terms), compared to USD182.88Billion (Rs. 12,79,442.35Crore) in April-September2019-20.
- Non-Oil and Non-Gold imports wereUSD23.88Billion in September2020, recording a negative growth of (-)12.63per cent, as compared to Non-Oil and Non-Gold importsof USD 27.33Billion in September2019. Non-Oil and Non-Gold imports wereUSD110.05Billion in April-September 2020-21, recording a negative growth of (-)34.13per cent, as compared to Non-Oil and Non-Gold importsUSD 167.08Billion in April-September 2019-20.
II. TRADE IN SERVICES
EXPORTS (Receipts)
- As per the latest press release by RBI dated 15thOctober 2020, exports in August2020 were USD 16.44Billion (Rs. 1,22,768.07Crore) registering a negative growth of (-)9.88per cent in dollar terms, vis-à-vis August2019. The estimated value of services export for September2020* is USD 16.34Billion.
IMPORTS (Payments)
- As per the latest press release by RBI dated 15thOctober 2020 imports in August 2020 were USD 9.60Billion (Rs. 71,662.62Crore) registering a negative growth of (-)20.06per cent in dollar terms, vis-à-vis August2019. The estimated value of service import for September2020* is USD 9.49Billion.
III.TRADE BALANCE
- MERCHANDISE: The trade deficit for September2020 was estimated at USD2.72Billion as against the deficit of USD11.67Billion inSeptember2019, which is a decline of (-) 76.66percent.
- SERVICES: As per RBI’s Press Release dated 15thOctober 2020 the trade balance in Services (i.e. Net Services export) for August 2020 is USD6.84Billion. The estimated trade balance in September 2020* is USD 6.85Billion.
- OVERALL TRADE BALANCE: Taking merchandise and services together, overall trade surplus for April-September 2020-21* is estimated at USD17.74Billion as compared to the deficit of USD49.91Billion in April-September 2019-20.
*Note: The latest data for services sector released by RBI is for August2020. The data for September2020 is an estimation, which will be revised based on RBI’s subsequent release.
MERCHANDISE TRADE
| EXPORTS & IMPORTS : (US $ Billion) | ||
| (PROVISIONAL) | ||
| SEPTEMBER | APRIL-SEPTEMBER | |
| EXPORTS(including re-exports) | ||
| 2019-20 | 26.02 | 159.16 |
| 2020-21 | 27.58 | 125.25 |
| %Growth 2020-21/ 2019-20 | 5.99 | -21.31 |
| IMPORTS | ||
| 2019-20 | 37.69 | 248.08 |
| 2020-21 | 30.31 | 148.69 |
| %Growth 2020-21/ 2019-20 | -19.60 | -40.06 |
| TRADE BALANCE | ||
| 2019-20 | -11.67 | -88.92 |
| 2020-21 | -2.72 | -23.44 |
| EXPORTS &IMPORTS: (Rs. Crore) | ||
| (PROVISIONAL) | ||
| SEPTEMBER | APRIL-SEPTEMBER | |
| EXPORTS(including re-exports) | ||
| 2019-20 | 1,85,642.32 | 11,13,886.17 |
| 2020-21 | 2,02,694.07 | 9,38,529.94 |
| %Growth 2020-21/ 2019-20 | 9.19 | -15.74 |
| IMPORTS | ||
| 2019-20 | 2,68,891.09 | 17,35,550.99 |
| 2020-21 | 2,22,708.15 | 11,14,686.58 |
| %Growth 2020-21/ 2019-20 | -17.18 | -35.77 |
| TRADE BALANCE | ||
| 2019-20 | -83,248.77 | -6,21,664.82 |
| 2020-21 | -20,014.08 | -1,76,156.64 |
SERVICES TRADE
| EXPORTS & IMPORTS (SERVICES) : (US $ Billion) | ||
| (PROVISIONAL) | August 2020 | April-August 2020-21 |
| EXPORTS (Receipts) | 16.44 | 80.28 |
| IMPORTS (Payments) | 9.60 | 45.95 |
| TRADE BALANCE | 6.84 | 34.33 |
| EXPORTS & IMPORTS (SERVICES): (Rs. Crore) | ||
| (PROVISIONAL) | August 2020 | April-August 2020-21 |
| EXPORTS (Receipts) | 1,22,768.07 | 6,05,633.40 |
| IMPORTS (Payments) | 71,662.62 | 3,46,586.98 |
| TRADE BALANCE | 51,105.45 | 2,59,046.42 |
| Source: RBI Press Release dated 15thOctober2020 | ||