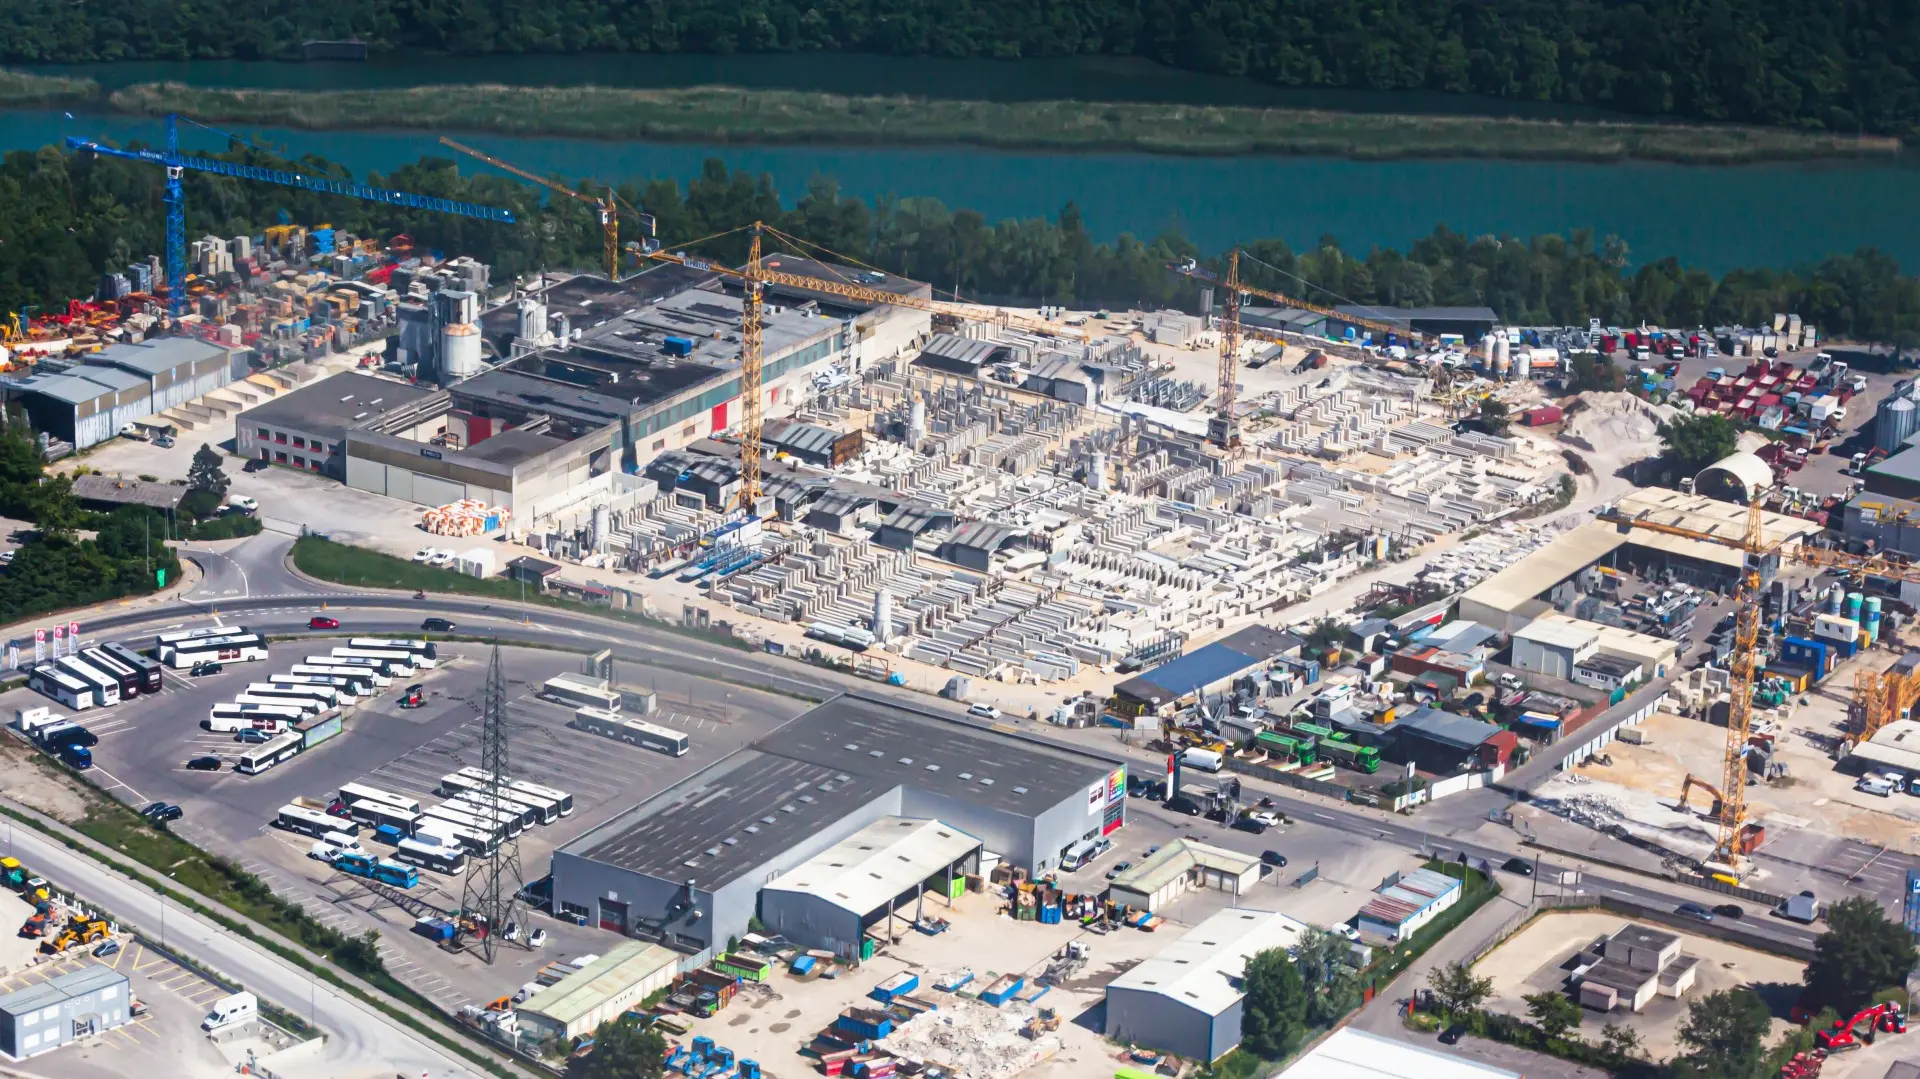
There were 7 Central Government Special Economic Zones (SEZs) and 12 State/Private Sector SEZs prior to the enactment of the SEZ Act, 2005. In addition, 416 proposals for setting up of SEZs in the country have been accorded formal approval under the SEZ Act, 2005. Presently, 351 SEZs are notified, out of which 232 SEZs are operational. States/Union Territories-wise details of SEZs is at Annexure-I.
SEZs being set up under the SEZ Act, 2005 and SEZ Rule, 2006 are primarily private investment driven. As per the Special Economic Zones Act, 2005, a Special Economic Zone (SEZ) may be established either jointly or severally by the Central Government, State Governments or any person for manufacture of goods or rendering services or for both or as a Free Trade and Warehousing Zone. Proposals for setting up of SEZs are considered by the Board of Approval only after written consent of the concerned State Government. No proposal for establishment of Special Economic Zone (SEZ) in Bihar is pending with the Department of Commerce at present.
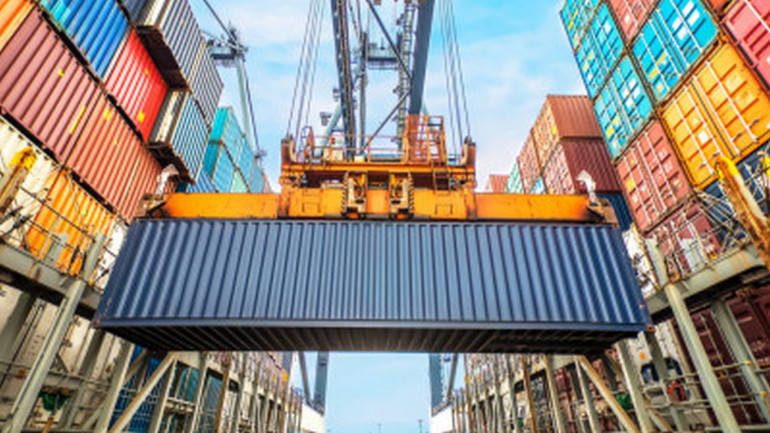
As per Section 30 of the SEZ Act, 2005, any goods removed from a SEZ to the Domestic Tariff Area shall be chargeable to duties of customs including anti-dumping, countervailing and safeguard duties under the Customs Tariff Act, 1975, where applicable, as leviable on such goods when imported. The revenue received by the Government from developed SEZ during the last five years, year-wise is as below:
| Year-wise revenue from duty for the Domestic Tariff Area Sale Transactions | |
| Year | Duty Amount Paid (Rs. Crores) |
| 2014-15 | 3,035 |
| 2015-16 | 4,183 |
| 2016-17 | 5,528 |
| 2017-18 | 18,095 |
| 2018-19 | 26,810 |
Annexure-1
| States/Union Territories-wise distribution of approved SEZs | |||||
| States/UTs | Central Government SEZs set up prior to the enactment of SEZs Act, 2005 | State Government/ Private Sector SEZs set up prior to the enactment of SEZs Act, 2005 | Formal Approvals granted under the SEZs Act, 2005 | Notified SEZs under the SEZ Act, 2005 | Total Operational SEZs (Including prior to SEZs Act + under the SEZs Act) |
| Andhra Pradesh | 1 | 0 | 32 | 27 | 19 |
| Chandigarh | 0 | 0 | 2 | 2 | 2 |
| Chhattisgarh | 0 | 0 | 2 | 1 | 1 |
| Delhi | 0 | 0 | 2 | 0 | 0 |
| Goa | 0 | 0 | 7 | 3 | 0 |
| Gujarat | 1 | 2 | 28 | 24 | 20 |
| Haryana | 0 | 0 | 24 | 21 | 6 |
| Jharkhand | 0 | 0 | 1 | 1 | 0 |
| Karnataka | 0 | 0 | 62 | 51 | 31 |
| Kerala | 1 | 0 | 29 | 25 | 19 |
| Madhya Pradesh | 0 | 1 | 10 | 5 | 5 |
| Maharashtra | 1 | 0 | 49 | 43 | 30 |
| Manipur | 0 | 0 | 1 | 1 | 0 |
| Nagaland | 0 | 0 | 2 | 2 | 0 |
| Odisha | 0 | 0 | 7 | 5 | 5 |
| Puducherry | 0 | 0 | 1 | 0 | 0 |
| Punjab | 0 | 0 | 5 | 3 | 3 |
| Rajasthan | 0 | 2 | 5 | 4 | 3 |
| Tamil Nadu | 1 | 4 | 53 | 50 | 40 |
| Telangana | 0 | 0 | 63 | 57 | 29 |
| Uttar Pradesh | 1 | 1 | 24 | 21 | 12 |
| West Bengal | 1 | 2 | 7 | 5 | 7 |
| GRAND TOTAL | 7 | 12 | 416 | 351 | 232 |
This information was given by the Minister of State in the Ministry of Commerce and Industry,Hardeep Singh Puriin a written reply in the Lok Sabha